Environment
Energy
The way in which Alamos’ operations consume energy plays a key role in the effectiveness of our Climate Change strategy, influences Air Quality, and represents a significant proportion of our operating costs. We consume energy primarily through electricity use and fossil fuel combustion (diesel, gasoline, propane and natural gas).
Electricity is primarily used by our crushing and milling operations, underground ventilation, and in material handling. At the Young-Davidson and Island Gold mines, electricity is sourced from Ontario’s low-carbon grid system which is comprised of 71% renewable and non-emitting sources such as hydro, nuclear, wind, and solar1. While our Ontario sites benefit from this clean supply, Alamos does not hold a Power Purchase Agreement with the province and therefore cannot claim procurement of renewable energy (as seen in Table 5.1). In December 2024, the Mulatos mine’s electrical transmission line was successfully connected to the Mexico grid. As a result, Mulatos has successfully phased out diesel generators for electricity production.
At our three operating mines, light vehicles run on gasoline, while heavy vehicles use diesel. In 2024, Young-Davidson and Island Gold supplemented a portion of this diesel with biodiesel – which emits less air pollution and is less toxic in the event of a spill. Young-Davidson uses compressed natural gas (CNG) for heating the underground mine and surface buildings during the winter, which emits fewer greenhouse gases than propane on a per-gigajoule (GJ) basis. Island Gold is assessing the feasibility of implementing CNG as well. While Magino currently relies on CNG to power the mill, Alamos anticipates connecting the site to the Ontario electrical grid in 2026, which is expected to significantly reduce associated air emissions.
In 2024, our sites continued their alignment with Alamos’ Energy & Greenhouse Gas Management Standard, which guides our mine sites in managing energy use, developing Energy Management Plans, and implementing strategies to reduce energy consumption. All our mines are encouraged to set site-specific targets for reducing total energy consumption, and each site completed projects to support these goals during the reporting year. Young-Davidson progressed the automation of their underground compressors and ventilation fans, reducing energy consumption by 5,843 GJ that year. Further, since 2022, all the mine’s lighting replacements have been LED – by the end of 2024, 32 of 35 possible locations had completed the switch.
The Island Gold mine also advanced several ongoing energy reduction projects. Improvements to the ventilation on demand system reduced energy consumption by 11,656 GJ in the first half of 2024 compared to H1 2023. Underground fan resizing, LED lighting retrofits, and advancements in the compressed air efficiency project are estimated to have further reduced the mine’s annual energy consumption by approximately 8,775 GJ.
The Mulatos mine reduced energy consumption by 8,794 GJ through various system modifications, including resizing motors in the crushing circuit. This is in addition to significant savings from the transmission line’s first month of operation, which eliminated the need for over 925,000 litres of diesel for electricity generation.
Energy Consumption2 (GJ)
Table 5.1
| Fuel Consumption | Alamos Total | Young-Davidson | Island Gold | Magino | Mulatos |
|---|---|---|---|---|---|
| Heavy Fuel Oil | 0 | 0 | 0 | 0 | 0 |
| Petroleum Diesel | 1,551,839 | 165,344 | 199,402 | 302,303 | 884,790 |
| Biodiesel | 27,836 | 20,177 | 7,659 | 0 | 0 |
| Gasoline | 46,849 | 2,188 | 16,076 | 5,438 | 23,147 |
| Propane Gas3 | 160,013 | 0 | 72,284 | 9,712 | 78,016 |
| Naphtha | 6,222 | 6,222 | 0 | 0 | 0 |
| Compressed Natural Gas4 | 609,289 | 207,667 | 0 | 401,621 | 0 |
| Renewables | 0 | 0 | 0 | 0 | 0 |
| Total | 2,402,047 | 401,598 | 295,421 | 719,074 | 985,953 |
Table 5.1
| Electricity Generated | 285,736 | 1,264 | 706 | 158,633 | 125,134 |
| Renewable Electricity Purchased | 0 | 0 | 0 | 0 | 0 |
| Non-Renewable Electricity Purchased | 1,392,465 | 989,939 | 384,813 | 4,267 | 13,446 |
Table 5.1
| Total | 3,794,512 | 1,391,536 | 680,234 | 723,342 | 999,400 |
| Portion of Total Supplied from Grid Electricity | 37% | 71% | 57% | 1% | 1% |
| Portion of Total from Renewable Sources | 1% | 1% | 1% | 0% | 0% |
Energy Consumption (GJ)
Figure 5.1
Young-Davidson
Island Gold
Magino
Mulatos
Energy Intensity Ratios7 (GJ)
Table 5.2
| Energy Production Type | Young-Davidson | Island Gold | Magino | Mulatos |
Alamos Total: 2024 |
Alamos Total: 2023 |
Alamos Total: 2022 |
|---|---|---|---|---|---|---|---|
| Energy per Tonne of Ore Mined | 0.50 | 1.71 | 0.39 | 0.25 | 0.42 | 0.37 | 0.39 |
| Energy per Tonne of Ore Treated | 0.50 | 1.73 | 0.62 | 0.25 | 0.46 | 0.29 | 0.31 |
| Energy per Ounce of Gold Production | 8.00 | 4.39 | 21.92 | 4.88 | 6.69 | 6.53 | 7.78 |
Water
OUR COMMITMENT
Water plays a central role at every stage of the mine life cycle, from localised use during exploration to managing final effluents throughout operations and closure. Both water quality and availability are critical to our business and the communities we impact, particularly Indigenous communities, for whom water is a vital resource. Recognizing these interconnected factors, Alamos is committed to responsible water management through collaboration with stakeholders.
Our governance structure for the management of water includes site-based Environmental leads who are responsible for day-to-day operations, the corporate-based Director of Environmental Sustainability and Vice President of Sustainability and External Affairs who provide oversight and support, and the Chief Operating Officer holding ultimate accountability.
Alamos employs a range of systems to identify and minimise water-related impacts. Our company-wide Water Management Standard provides sites with guidance for effective water management practices, covering the withdrawal, use, storage, recycling, treatment and discharge of water. This standard establishes site-specific requirements for developing robust water monitoring and control plans to reduce potential effects on the environment while complying with all regulatory requirements. We also maintain comprehensive surface and groundwater monitoring programs across all our sites. Multiple locations at each site are routinely monitored to assess water quantity – measuring water levels, flow velocities, and other hydrological indicators – as well as water quality, through external laboratory analysis of grab samples for a broad suite of analytes. Additionally, we conduct regular reviews of site-wide water balances and water management facilities at each of our operations.
Company-Wide Water Interactions
Table 5.3
| Metric | 20248 | 20239 | 202210 |
|---|---|---|---|
| Total Water Withdrawn (ML) (water taken from the environment) | 10,385 | 6,177 | 6,496 |
| Total Water Discharged (ML) (water released to the environment) | 4,787 | 3,282 | 3,051 |
| Total Water Treated (ML) | 4,150 | 2,718 | 1,708 |
| Total Water Consumed (ML) (= withdrawals – discharges) | 5,598 | 2,895 | 3,445 |
| Total Water Recycled/Reused (ML) (water used from on-site stores) | 17,065 | 17,461 | 13,372 |
| Total Water Used (ML) (= consumed + recycled) | 22,663 | 20,365 | 16,817 |
| Portion of Water Recycled/Reused (= recycled / used) | 80% | 90% | 79.5% |
| Total Water Intensity (m3/t) (= consumed / tonne of ore treated) | 0.67 | 0.25 | 0.30 |
Throughout the mine life cycle, water requirements evolve across various phases of operation. Water withdrawals, discharges, storage, treatment, consumption, and usage fluctuate constantly. While Alamos has not yet established company-wide water-related objectives and targets, each of our mines sets its own goals to maximise water reuse and recycling.
Company-Wide Water Interactions
Figure 5.2
YOUNG-DAVIDSON
The Young-Davidson Mine predominantly interacts with the nearby Montreal River; withdrawing freshwater from an upstream portion and discharging treated effluent downstream. The river is not classified as water-stressed or a listed conservation area, but it does hold significant importance to local Indigenous Peoples. Additionally, groundwater withdrawals also occur at the Young-Davidson Mine, as water is pumped out from underground mine workings to allow safe operations.
In 2024, total water withdrawals from underground and surface sources, including rain and snowmelt, amounted to 3,957 ML, while total discharges reached 1,891 ML – both accounting for less than 5% of the river’s annual average volume.
All discharged water is first processed by the mine’s extensive water treatment system. Underground mine water is pumped to surface and treated through a Moving Bed Biofilm Reactor (MBBR) which facilitates the biological aerobic destruction of ammonia, alongside a chemical dosing system that precipitates metals. Surface contact water from the tailings facilities is sent to the water treatment plant, where it undergoes pre-treatment (agitation with hydrogen peroxide, ferric sulfate, and lime, followed by clarification) before passing through the Submerged Aerobic Growth Reactor (SAGR) which removes ammonia and residual metals. Once treated, effluents from the MBBR and SAGR are directed to the mine water settling pond before being discharged through a buried pipeline to the environment.
The site adheres to the Metal and Diamond Mining Effluent Regulations (MDMER), which establish concentration limits for key substances including arsenic, copper, cyanide, lead, nickel, zinc, suspended solids, radium 226, and un-ionized ammonia.
Additionally, the MDMER requires Environmental Effects Monitoring studies, which analyze an additional 19 parameters such as chromium, iron, mercury11, and selenium. The site has a provincially regulated Environmental Compliance Approval (ECA) for water discharge.
In 2024, Young-Davidson had two non-compliant water discharges: one in January due to exceedances of Daphnia Magna (water flea) mortality, and another in September for Total Suspended Solids. In both cases the source of the issue was quickly identified, and remediation measures were implemented.
2024 Young-Davidson Water Withdrawals and Discharges12
Table 5.4
| Water Type | Water Withdrawn (ML)13 | Water Discharged (ML)14 |
|---|---|---|
| Surface Water | 460 | 1,882 |
| Ground Water | 1,466 | 9.125 |
| Sea Water | 0 | 0 |
| Rain and Snow Melt | 2,031 | n/a |
| Third Party Water | 0.140 | 1.113 |
| Produced Water | 0 | 0 |
2024 Young-Davidson Water Consumption
Table 5.5
| Metric | Value |
|---|---|
| Total Water Consumption (ML) | 2,066 |
| Water Intensity (m3/t)15 | 0.74 |
ISLAND GOLD
The Island Gold Mine sources its domestic water from Maskinonge Lake, while discharges are directed to Goudreau Lake. Although neither lake is classified as water-stressed or a listed conservation area, both hold significant importance to local Indigenous Peoples. Additionally, groundwater withdrawals also occur at Island Gold, as water is pumped out from underground mine workings to maintain safe operations.
In 2024, a total of 1,756 ML of water was withdrawn from Maskinonge Lake and underground sources, while 1,121 ML was discharged into Goudreau Lake – both representing less than 5% of the annual average volume of their respective water bodies. To protect Goudreau Lake’s water quality, the mine uses semi-passive water treatment methods. Effluents are treated in holding ponds, where solids are removed through coagulation and flocculation, cyanide naturally degrades, and acidity (pH) is chemically regulated before discharge. Water treatment is guided by the MDMER and an ECA.
In 2024, there were no unplanned water discharges at Island Gold, and effluent releases were compliant with regulatory limits.
2024 Island Gold Water Withdrawals and Discharges16
Table 5.6
| Water Type | Water Withdrawn (ML)17 | Water Discharged (ML)18 |
|---|---|---|
| Surface Water | 52 | 1,100 |
| Ground Water | 569 | 19 |
| Sea Water | 0 | 0 |
| Rain and Snow Melt | 1,115 | n/a |
| Third Party Water | 19 | 1 |
| Produced Water | 0 | 0 |
2024 Island Gold Water Consumption
Table 5.7
| Metric | Value |
|---|---|
| Total Water Consumption (ML) | -485 |
| Water Intensity (m3/t)19 | -1.10 |
MAGINO
Water management at the Magino Mine maximizes the reuse and recycling of industrial water in the processing/TF circuit, minimising freshwater makeup requirements. Make-up water required for processing is provided primarily from the reuse of water taken for construction dewatering activities (the mine commenced commercial operations on November 1, 2023, and in 2024 continued the transition from construction to fully developed operations). The Magino Mine draws surface water from on-site ponds used for management of mine water and sumps in construction areas. Groundwater withdrawal takes place for the dewatering of the open pit. In 2024, a total of 1,481 ML of water was withdrawn, while 1,490 ML was discharged – nearly half of these volumes resulting from precipitation and runoff.
Before being released into Otto Lake, discharged water is passively treated through an on-site constructed wetland, and settled in the Water Quality Control Pond. Over the course of 2024, withdrawals and discharges exceeded 5% of the annual average volume of the affected water bodies. However, none of these water bodies are classified as water-stressed or designated conservation areas. Local Indigenous communities were consulted on water-related permits and continue to be engaged in water management and discharge activities.
The Magino Mine operates under the MDMER and an ECA, which set effluent quality limits for priority substances. In 2024, there was one instance of non-compliance related to a Total Phosphorus reading of discharged water, with a recorded concentration of 0.0549 mg/L – slightly above the ECA limit of 0.05 mg/L.
2024 Magino Water Withdrawals and Discharges20
Table 5.8
| Water Type | Water Withdrawn (ML)21 | Water Discharged (ML)22 |
|---|---|---|
| Surface Water | 440 | 1,490 |
| Ground Water | 380 | 0 |
| Sea Water | 0 | 0 |
| Rain and Snow Melt | 662 | n/a |
| Third Party Water | 818 | 0 |
| Produced Water | 0 | 0 |
2024 Magino Water Consumption
Table 5.9
| Metric | Value |
|---|---|
| Total Water Consumption (ML) | 809 |
| Water Intensity (m3/t)23 | 0.65 |
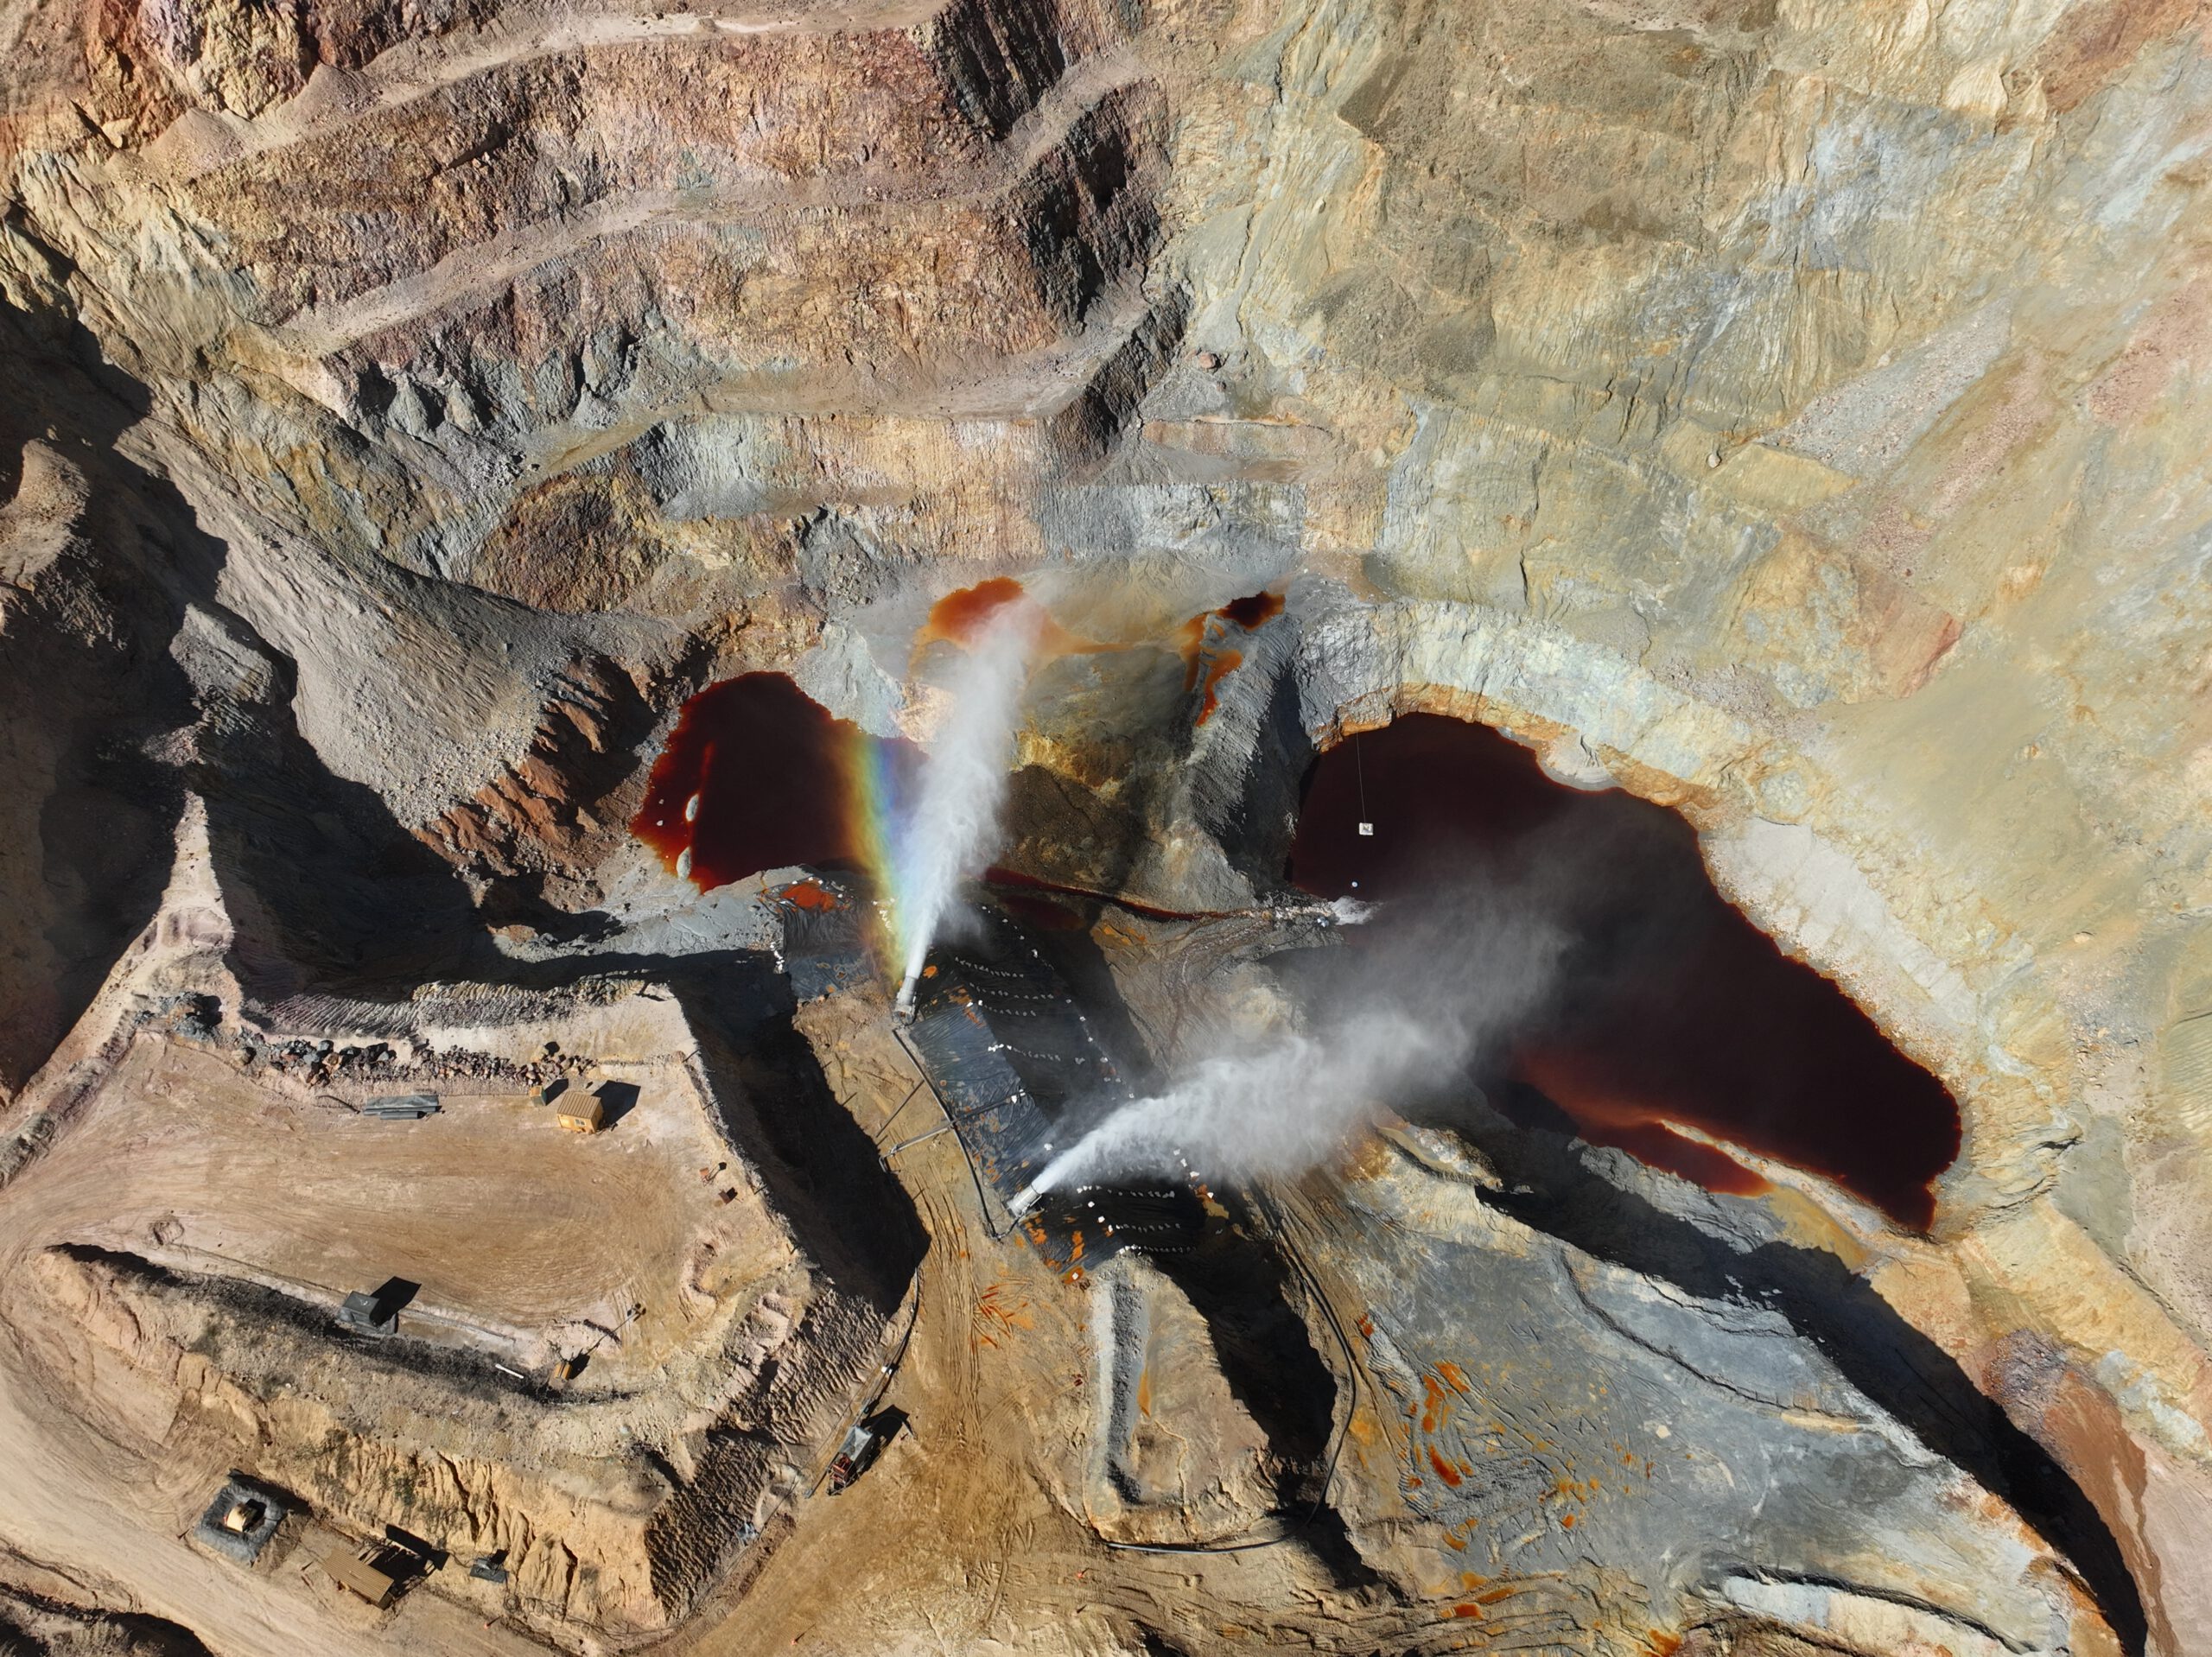
MULATOS
The Mulatos Mine, including La Yaqui Grande, sources surface water from the Mulatos River and groundwater from the Yécora aquifer. While the Mulatos River is home to one protected species (the Yaqui Catfish), the mine’s water withdrawals remain below 5% of the river’s annual average volume – amounting to 1,378 ML of the total 2,373 ML withdrawn in 2024 – ensuring minimal impact on the area’s water resources.
In 2024, Mulatos discharged only 285 ML of water, largely due to the June shut down of the water treatment plant associated with the mined-out Mulatos pit. Additionally, a significant portion of stored water was dissipated using evaporators. Before decommissioning, the water treatment plant used lime-based chemical precipitation to balance pH and remove heavy metals and sulfates from discharged water, which flowed into the Mulatos Creek. Domestic sewage from the mine undergoes biological treatment via activated sludge before being discharged to the Los Bajos Creek. No water was discharged from La Yaqui Grande in 2024.
The mine’s water discharge treatment is governed by Mexican Official Standard NOM-001-SEMARNAT-2021, which sets maximum allowable pollutant limits for wastewater released into national water bodies. Mining-related discharges are closely monitored for cyanide, heavy metals, and acidity-related parameters, while domestic sewage focuses on biological parameters.
There were no unplanned discharges or instances of non-compliance with discharge limits in 2024. According to Aqueduct24, the World Resources Institute’s Water Risk Atlas tool, the Mulatos Mine is in an arid region with low water use. Although the broader surrounding area experiences high-to-extremely-high water stress, the specific location of Mulatos does not qualify.
2024 Mulatos Water Withdrawals and Discharges25
Table 5.10
| Water Type | Water Withdrawn (ML)26 | Water Discharged (ML)27 |
|---|---|---|
| Surface Water | 1,378 | 285 |
| Ground Water | 17.4 | 0 |
| Sea Water | 0 | 0 |
| Rain and Snow Melt | 978 | n/a |
| Third Party Water | 0 | 0 |
| Produced Water | 0 | 0 |
2024 Mulatos Water Consumption
Table 5.11
| Metric | Value |
|---|---|
| Total Water Consumption (ML) | 2,088 |
| Water Intensity (m3/t)28 | 0.53 |
Mulatos is actively managing Acid Rock Drainage (Table 5.12) due to the site’s natural geology. As a result, a significant portion of withdrawn water must be stored on-site before being safely released through evaporators. Stored water represents a large share of the total volume withdrawn but not yet discharged (Table 5.10).
Acid Rock Drainage
Table 5.12
| Status | Young-Davidson | Island Gold | Magino | Mulatos |
|---|---|---|---|---|
| Predicted to Occur | False | False | True | True |
| Actively Mitigated | False | False | True | True |
| Under Treatment/Remediation | False | False | True | True |
Waste
The safe storage, handling, and disposal of all types of waste is essential at all Alamos operations. Our internal Non-Hazardous & Hazardous Waste Management Standard and Mine Ore & Waste Stockpile Management Standard apply to all sites and define the minimum requirements to manage waste in accordance with our values.
The Non-Hazardous & Hazardous Waste Management Standard stipulates that: hazardous and non-hazardous waste, including domestic waste, be separated and labelled before storage and disposal; on-site waste storage facilities align with leading industry practices, such as secondary containment and coverage, as well as applicable regulations, and; transportation and off-site disposal of waste occur within 90 days of generation, handled exclusively by licensed contractors.
The Mine Ore & Waste Stockpile Management Standard stipulates that sites must: assess the potential for acid generation and metal leaching at all stockpiles; evaluate the geotechnical and seismic stability of stockpiles with a lifespan exceeding one year; construct, operate, maintain, and monitor stockpiles to ensure long-term geotechnical stability, and; develop and maintain site-specific Mine Ore and Waste Stockpile Materials Management Plans that define internal procedures and responsibilities.
Each site implements its own waste management program to ensure compliance with these standards, as well as any jurisdictional requirements. This commitment extends to all stages of the mine life cycle, ensuring both Alamos and our third-party waste management suppliers uphold leading practices in environmental stewardship.
Alamos is committed to minimising waste generation across our operations. Waste-related impacts arise both directly – such as increased safety risks from on-site storage – and indirectly through our value chain, including increased land use by landfills and emissions from off-site incineration. To mitigate these effects, we focus on procuring materials efficiently to meet operational needs while maximising recycling opportunities whenever possible. At Young-Davidson, a Refuse Management Plan ensures the proper handling of waste and recyclables, from source (both surface and underground) to final disposal.
This plan outlines waste categorization, sorting protocols, bin locations, and the roles and responsibilities of all involved parties, reinforcing a waste reduction mindset. Island Gold also prioritizes the 3 Rs – waste reduction, reuse, and recycling – continuing this commitment through the employee-led 3 Rs Sub-committee, which advanced key initiatives throughout 2024.
Waste Management Metrics (Tonnes) – NON-MINERAL WASTE
Table 5.13
| Type of Waste | Young-Davidson | Island Gold29 | Magino30 | Mulatos |
Alamos Total: 2024 |
Alamos Total: 2023 |
Alamos Total: 2022 |
|---|---|---|---|---|---|---|---|
| Non-Hazardous Waste Disposed31 | 730 | 5,068 | 4,481 | 564 | 10,843 | 4,179 | 3,750 |
| Non-Hazardous Waste Recycled/Reused | 7,417 | 938 | 498 | 355 | 9,208 | 2,356 | 2,712 |
| Hazardous Waste Disposed | 72 | 15 | 2 | 314 | 404 | 673 | 716 |
| Hazardous Waste Recycled/Reused | 116 | 101 | 110 | 344 | 671 | 596 | 496 |
| Total Non-Mineral Waste Generated | 8,335 | 6,123 | 5,090 | 1,578 | 21,126 | 7,805 | 7,674 |
| % Non-Mineral Waste Recycled/Reused | 90% | 17% | 12% | 44% | 47% | 37.8% | 41.8% |
Waste Management Metrics (Tonnes) – MINERAL WASTE32
Table 5.13
| Non-Hazardous Waste Rock Disposed (NPAG)35 | 449,267 | 420,411 | 6,810,244 | 3,345,682 | 11,025,604 | 1,719,759 | 6,134,320 |
| Non-Hazardous Waste Rock Recycled/Reused | 1,150,436 | 231,719 | 134,656 | 0 | 1,516,811 | 740,460 | 1,686,618 |
| Hazardous Waste Rock Disposed (PAG)36 | 0 | 0 | 298,147 | 12,839,351 | 13,137,498 | 22,592,179 | 24,392,920 |
| Tailings Disposed37 | 965,147 | 392,460 | 1,252,089 | 0 | 2,609,696 | 3,317,055 | 3,291,903 |
| Hazardous Mineral Waste Recycled/Reused38 | 1,841,045 | 0 | 0 | 0 | 1,841,045 | 1,662,950 | 0 |
| Total Mineral Waste Generated39 | 3,255,459 | 812,871 | 8,360,480 | 16,185,032 | 28,613,842 | 27,628,993 | 35,505,761 |
Waste Management Metrics (Tonnes) – TOTAL MINERAL AND NON-MINERAL WASTE DISPOSED, RECYCLED, AND GENERATED
Table 5.13
| Total Waste Disposed42 | 2,565,652 | 817,954 | 8,364,963 | 16,185,911 | 27,934,481 | 27,633,845 | 33,823,609 |
| Total Waste Recycled/Reused | 2,999,014 | 232,758 | 135,264 | 699 | 3,367,735 | 2,405,362 | 1,689,826 |
| Total Waste Generated43 | 4,414,231 | 818,994 | 8,365,570 | 16,186,610 | 29,785,405 | 27,536,798 | 35,513,435 |
| % Waste Recycled/Reused | 68% | 28% | 2% | 0% | 11% | 8.7% | 4.8% |
Company-Wide Waste Generation vs Waste Recycling/Reuse (tonnes)
Figure 5.3
Waste is classified as hazardous if it poses a risk to the health and safety of people and/or the natural environment. All people handling hazardous waste receive specialised training in proper storage and handling procedures. Additionally, hazardous waste risks are integrated into routine health and safety risk assessments. Each site has a dedicated Spill Response Procedure that outlines the protocols for safely managing and remediating spills.
Unfortunately, the Young-Davidson Mine had four reportable spills/releases during the year (Table 5.14). All affected areas have been remediated, and follow-up monitoring indicates no anticipated long-term impacts. No other reportable spills occurred at any other Alamos site.
Reportable Spills
Table 5.14
| Location | Material | Volume | Impact / Response |
|---|---|---|---|
| Young-Davidson | Diesel | 200 L | Contaminated roadbed material (packed gravel) was excavated, removed from site by a licensed hazardous waste contractor and replaced with uncontaminated material. |
| Young-Davidson | Waste Oil | 750 L | 7 totes of contaminated soil were excavated to a max depth of 16 inches and replaced with uncontaminated material. |
| Young-Davidson | Fuel Oil Firefighting Foam | 90 L 245 L 280 L | Contaminated soil and roadbed material were removed via excavator and dump truck and were replaced with uncontaminated material. Several composite soil, shoreline, and water samples were taken on several occasions post-incident from the surrounding area. |
| Young-Davidson | Tailings Seepage | n/d | Two pools of seepage were identified from the East Dam in December 2024, assessed as being likely due to a horizontal tear in the geomembrane liner. A flow rate of 1.2L/s was estimated. Investigation and remediation are still underway. |
Air Quality
Alamos conducts air quality monitoring at all operations to protect human and environmental health while complying with jurisdictional regulations. Our Canadian operations adhere to the Environmental Compliance Approvals (ECAs) for Air and Noise issued by Ontario’s Ministry of Environment, Conservation and Parks (MECP). Additionally, they are federally required to report significant air emissions annually to the National Pollutant Release Inventory (NPRI). In Mexico, air emissions are tracked as required by local regulations. However, unlike in Canada, comprehensive monitoring of Volatile Organic Compounds (VOC), Hazardous Air Pollutants (HAP), and PM2.5 is not mandated. As a result, while the Mulatos Mine complies with all applicable regulatory requirements, it does not systematically track these specific air quality indicators.
Significant Air Emissions (tonnes)
Table 5.15
| Type of Emission | Young-Davidson | Island Gold | Magino | Mulatos |
Alamos Total: 2024 |
Alamos Total: 2023 |
Alamos Total: 2022 |
|---|---|---|---|---|---|---|---|
| NOx | 35.4 | 438.6 | 281.2 | 2,746.9 | 3,502.1 | 4,870.3 | 4,844.0 |
| SOx | 0.5 | 0.7 | 0.2 | 14.8 | 16.2 | 19.8 | 15.4 |
| POP | 0.0 | 0.0 | 0.0 | 0.0 | 0.0 | 0.0 | 0.0 |
| VOC | 32.0 | 8.1 | 0.0 | – | 40.1 | 40.1 | 42.9 |
| HAP | 33.0 | 0.0 | 0.0 | – | 33.0 | 39.0 | 39.5 |
| PM10 | 478.4 | 79.1 | 211.9 | – | 769.4 | 91.844 | 226.8 |
| PM2.5 | 118.2 | 57.0 | 26.9 | – | 202.0 | 64.2 | 60.0 |
| CO | 214.7 | 277.8 | 45.7 | 720.6 | 1,258.8 | 1,667.4 | 582.0 |
| Pb | 0.0 | 0.0 | 0.4 | 0.0 | 0.4 | 0.00033 | 0.00123 |
| Hg | 0.0 | 0.0 | 0.0 | 0.0 | 0.0 | 0.00002 | 0.00000 |
Nature
Biodiversity
Mining can have significant impacts on the natural environment. At the local level, the construction and operation phases of a mine can alter terrestrial and aquatic habitat and airways and affect ecological processes beyond their natural range of variation. These changes can contribute to local species decline and broader shifts in ecosystem dynamics.
The extent of habitat conversion depends on the mining method. Open-pit mines, such as Mulatos, inherently impact larger surface areas compared to underground mines like Island Gold. As a result, their direct effects on biodiversity tend to be more pronounced. Beyond local impacts, mining activities also contribute to climate change through emissions, which can drive habitat alterations on a global scale.
IUCN Red List Species Potentially Impacted by Operation
Table 5.16
| Classification | Young-Davidson | Island Gold | Magino | Mulatos | Lynn Lake | Türkiye Combined Projects | El Chanate |
|---|---|---|---|---|---|---|---|
| Critically Endangered | 145 | 0 | 0 | 0 | 0 | 146 | 147 |
| Endangered | 148 | 249 | 150 | 251 | 252 | 153 | 0 |
| Vulnerable | 2 | 6 | 1 | 5 | 4 | 8 | 0 |
| Near Threatened | 1 | 3 | 5 | 4 | 2 | 8 | 3 |
| Least Concern | 159 | 29 | 141 | 182 | 11 | 154 | 48 |
| Ecosystem Containing Endangered Species (High Biodiversity Value) | Freshwater & Terrestrial | Terrestrial | Terrestrial | Freshwater | Freshwater & Terrestrial | Freshwater & Terrestrial | Terrestrial |
While Table 5.15 lists species potentially affected by our operations as identified on the International Union for Conservation of Nature’s (IUCN’s) Red List, we also track and manage species at risk in compliance with the jurisdictional requirements outlined in Table 5.16.
Species at Risk per Jurisdictional Regulation
Table 5.17
| Classification | Young-Davidson | Island Gold | Magino | Mulatos | Lynn Lake |
|---|---|---|---|---|---|
| Regulation |
Canada’s Species at Risk Act Ontario’s Endangered Species Act |
Canada’s Species at Risk Act Ontario’s Endangered Species Act |
Canada’s Species at Risk Act, Ontario’s Endangered Species Act |
Ley General de Vida Silvestre NOM-059-Semarnat-2010 |
Canada’s Species at Risk Act Manitoba’s Endangered Species and Ecosystems Act |
| Endangered | 354 | 255 | 256 | 357 | 258 |
| Threatened | 259 | 160 | 661 | 1062 | 663 |
| Special Concern | 364 | 165 | 266 | 1267 | 768 |
The Young-Davidson mine is situated adjacent to the protected West Montreal River Provincial Park, and the Mulatos mine contains a portion of the protected Mulatos River. As all Alamos sites (and 100% of our proven and probable mineral reserves) are located within or near either endangered species habitat or protected conservation areas, we are mindful of our direct impacts on nature. Our internal Biodiversity and Land Use Standard applies to all Alamos operations. The Standard stipulates that prior to any new surface disturbance, authorisation must be sought from the Environmental department (who are responsible for securing all relevant permits), and an assessment of potential impacts to cultural resources, traditional knowledge, territorial lands, archeological features, listed wildlife and vegetation species, sensitive areas, sensitive habitats, and wetlands must be conducted. The Standard also requires that sites minimise ecosystem disturbance to only what is essential for safe and efficient operations, and that they control the influence of introduced species – particularly invasive plant species, weeds, feral predators, and plant and animal diseases. Further, working closely with environmental professionals and local authorities, Alamos applies the Mitigation Hierarchy principles in seeking to avoid, minimise, restore/rehabilitate, or offset our impacts wherever possible.
In 2024, Alamos continued working towards our goal of implementing a Biodiversity and Land Use Management Plan (BLUMP) at each of our operating sites. The BLUMP at Island Gold is complete, and those at Young-Davidson and Mulatos are underway. These BLUMPs outline procedures and processes to protect fragile ecosystems, habitats, and endangered species in the specific context of each site. While our policies and practices are not specifically developed to satisfy the IFC’s Performance Standards on Environmental and Social Sustainability, they are aligned with the general themes of Performance Standard 6: Biodiversity Conservation and Sustainable Management of Living Natural Resources.
Land Use (ha)
Table 5.18
| Purpose of Land | Young-Davidson | Island Gold | Magino | Mulatos | Lynn Lake Project | El Chanate |
|---|---|---|---|---|---|---|
| Size of Operation69 | 1,413 | 1,375 | 2,213 | 22,678 | 1,172 | 2,806 |
| Area Disturbed During the Year | 0 | 27 | 13.8 | 0 | 0 | 0 |
| Area Rehabilitated During the Year | 0 | 4 | 0 | 2 | 0 | 0 |
| Total Area Disturbed and Unrehabilitated at Year-End | 432 | 2361 | 414 | 1,056 | 166 | 116 |
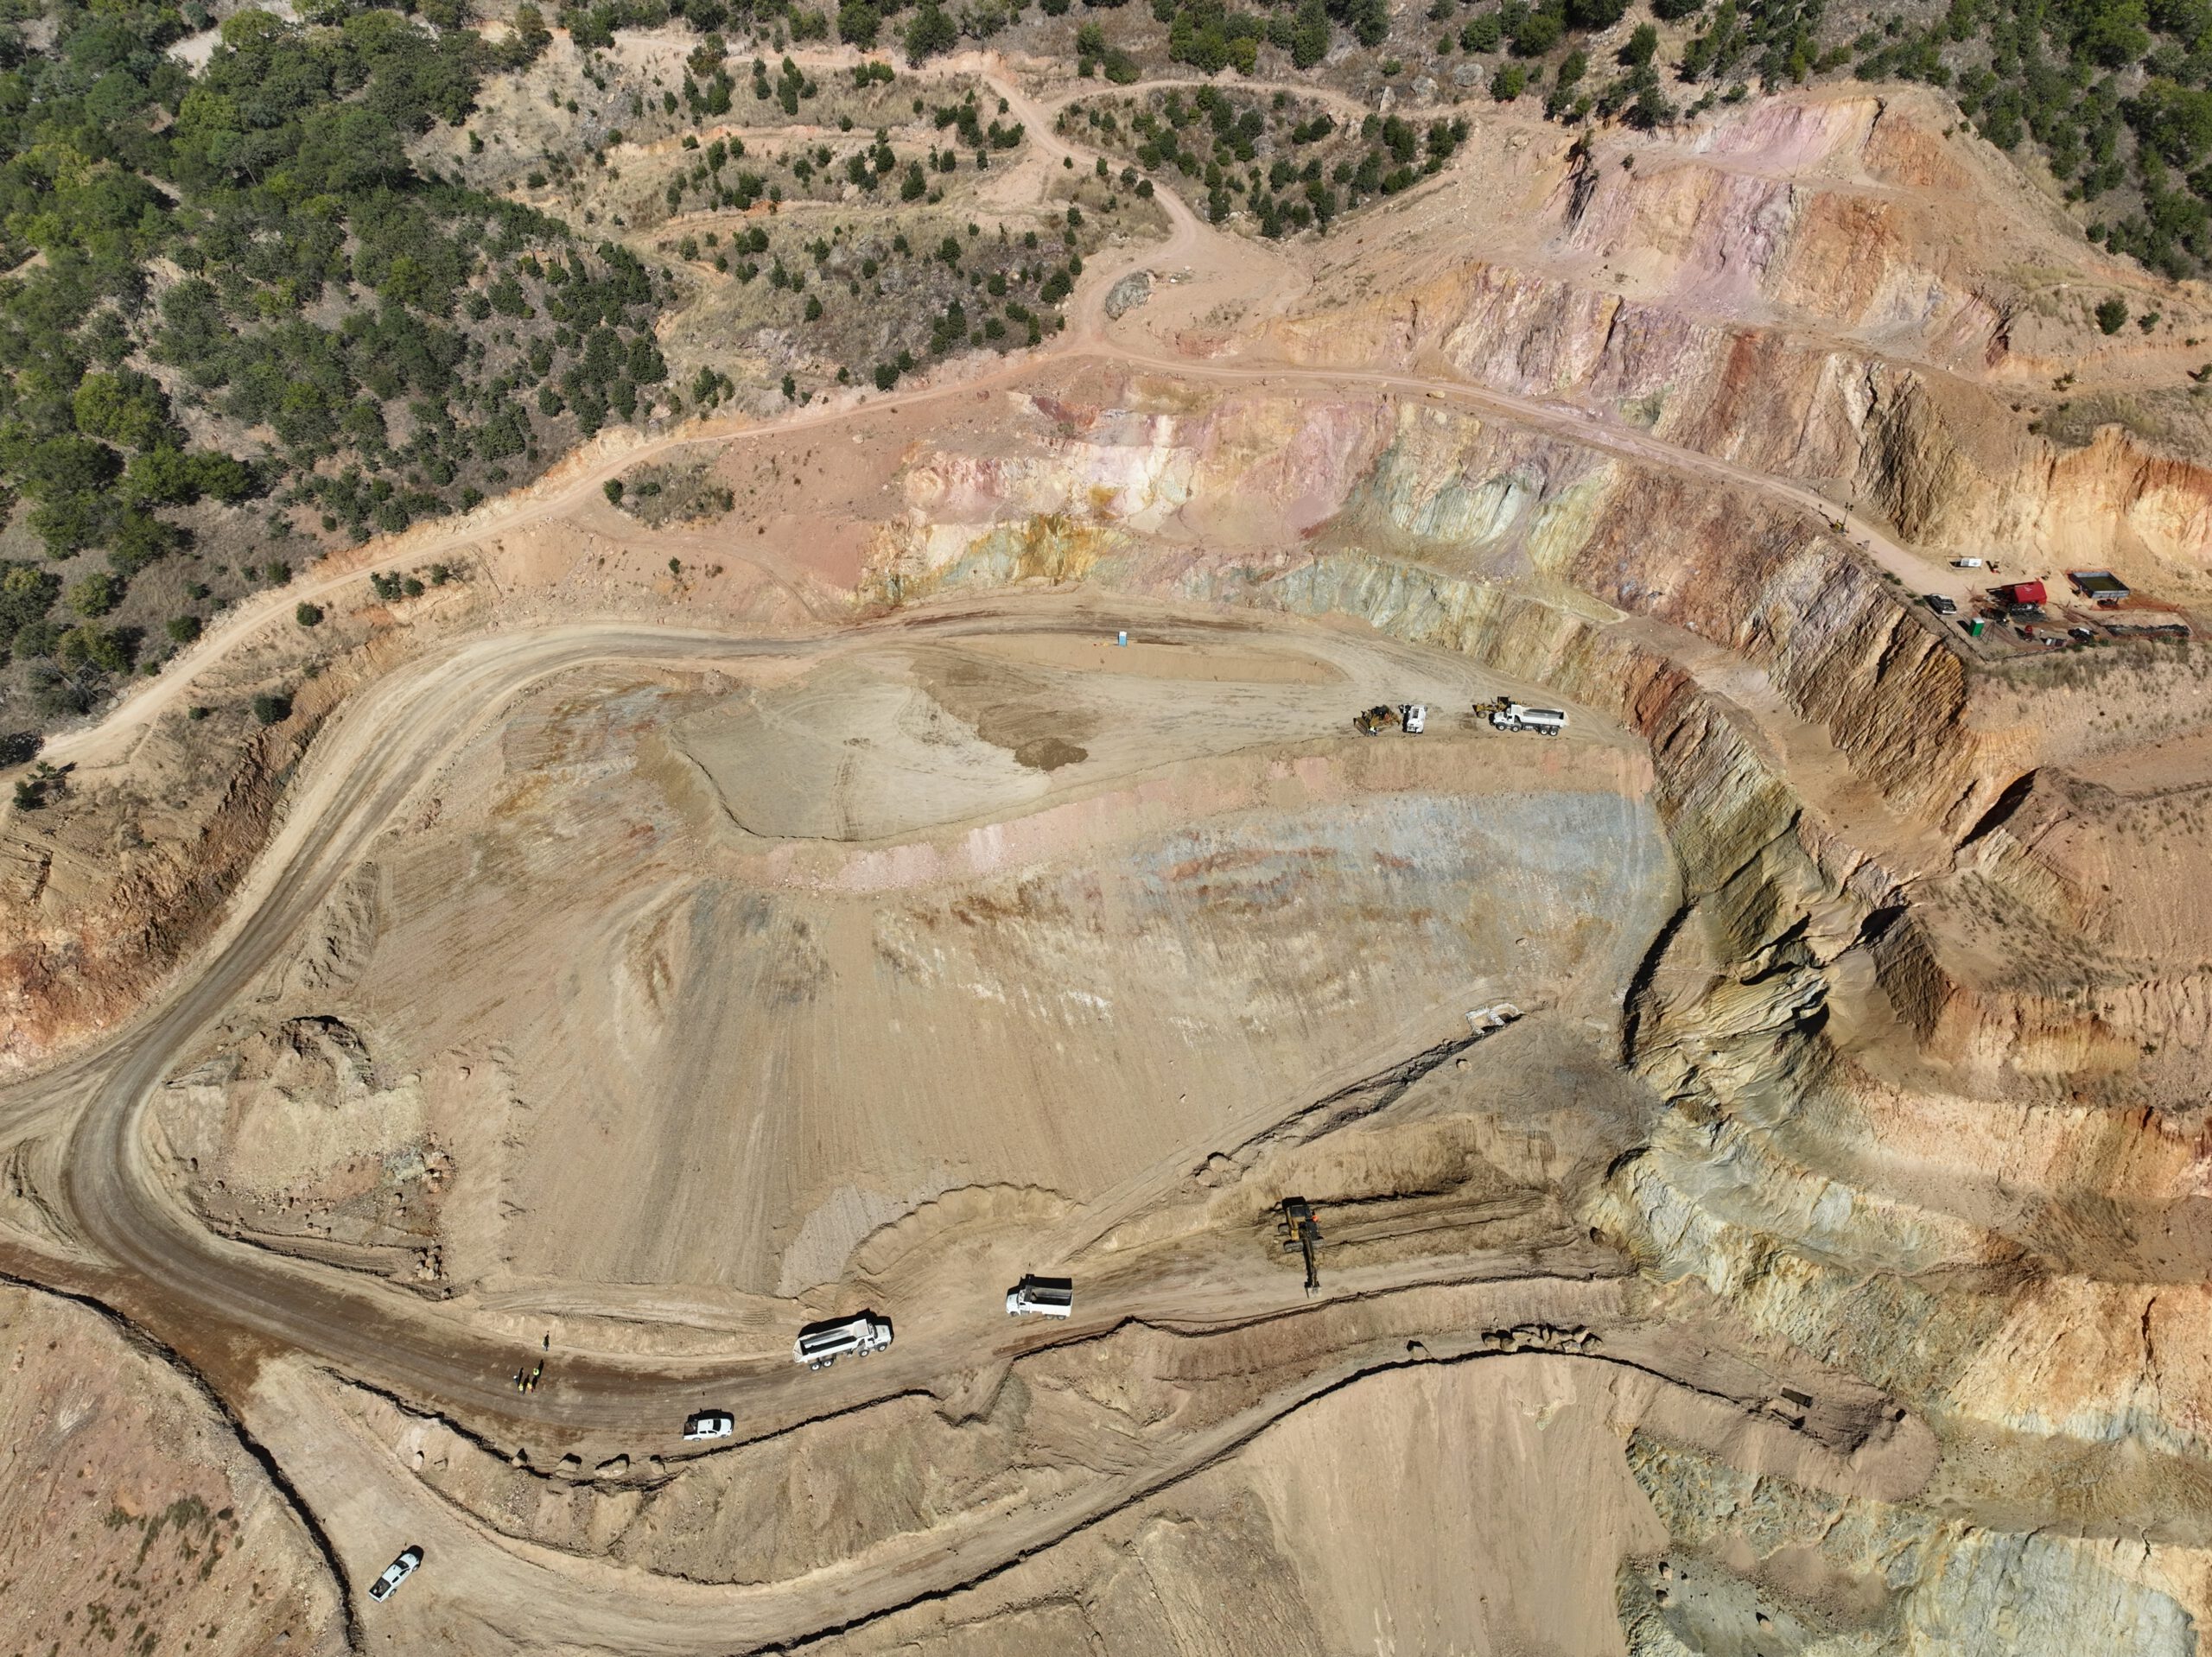
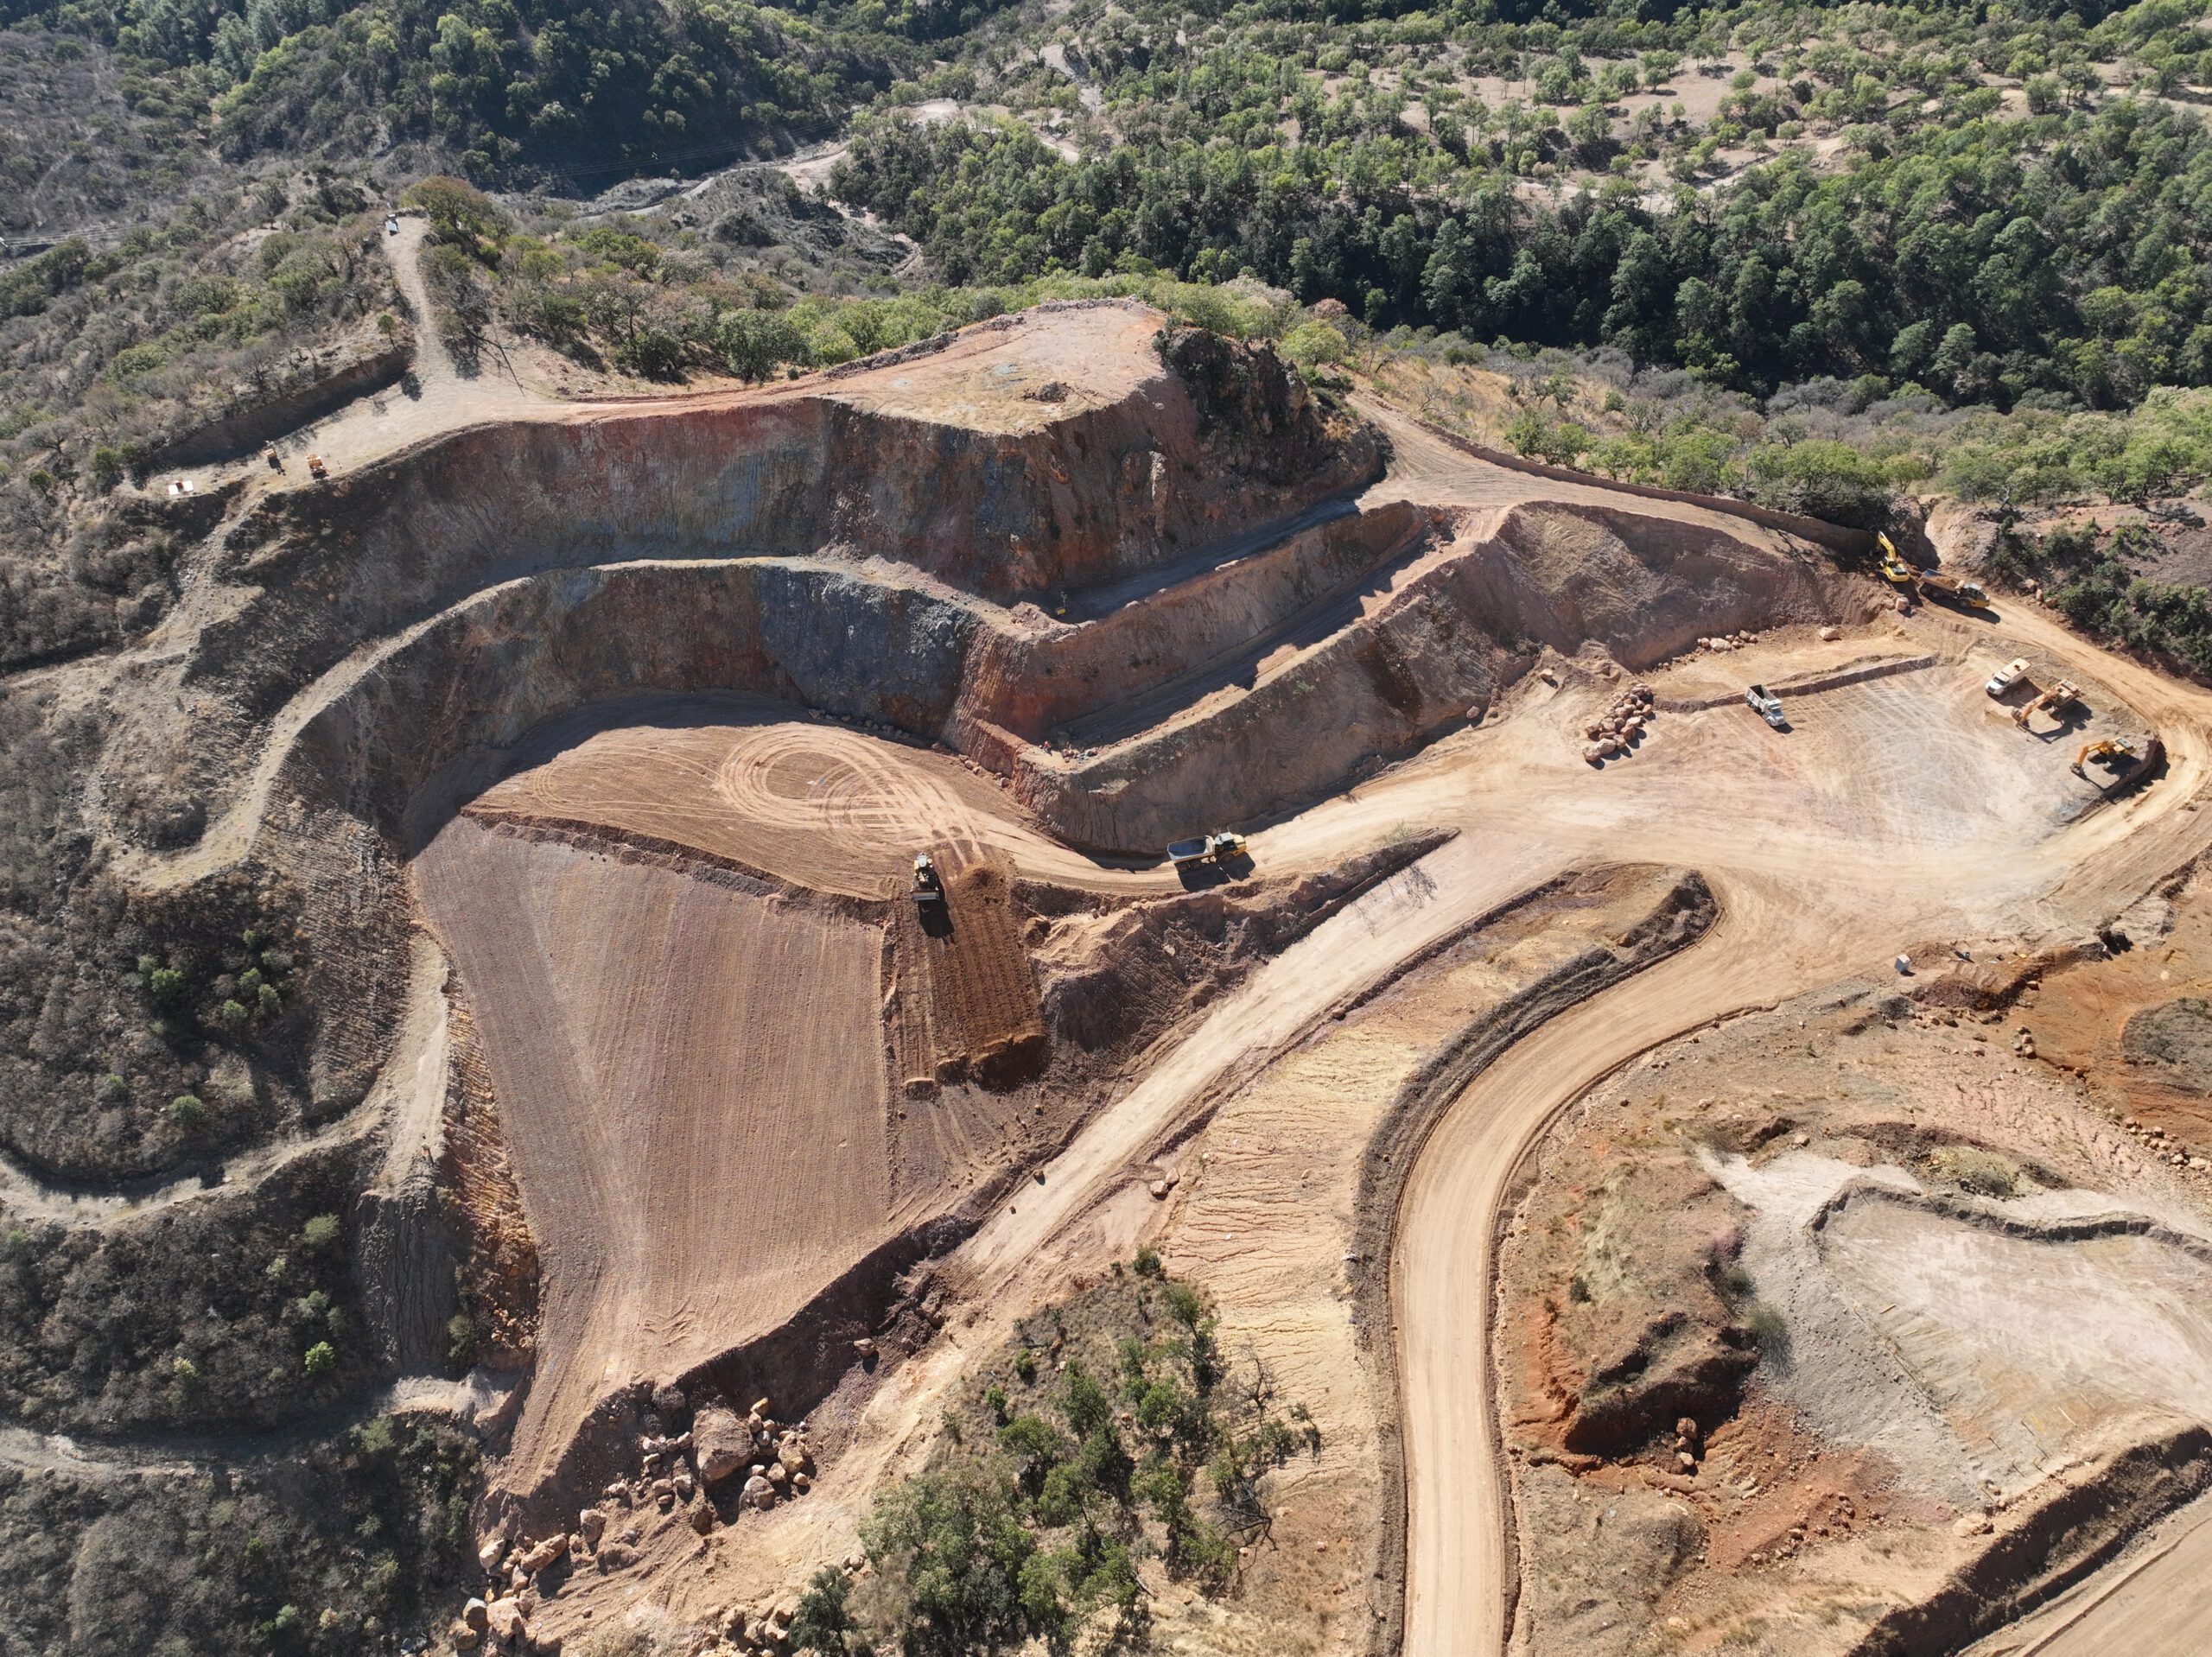
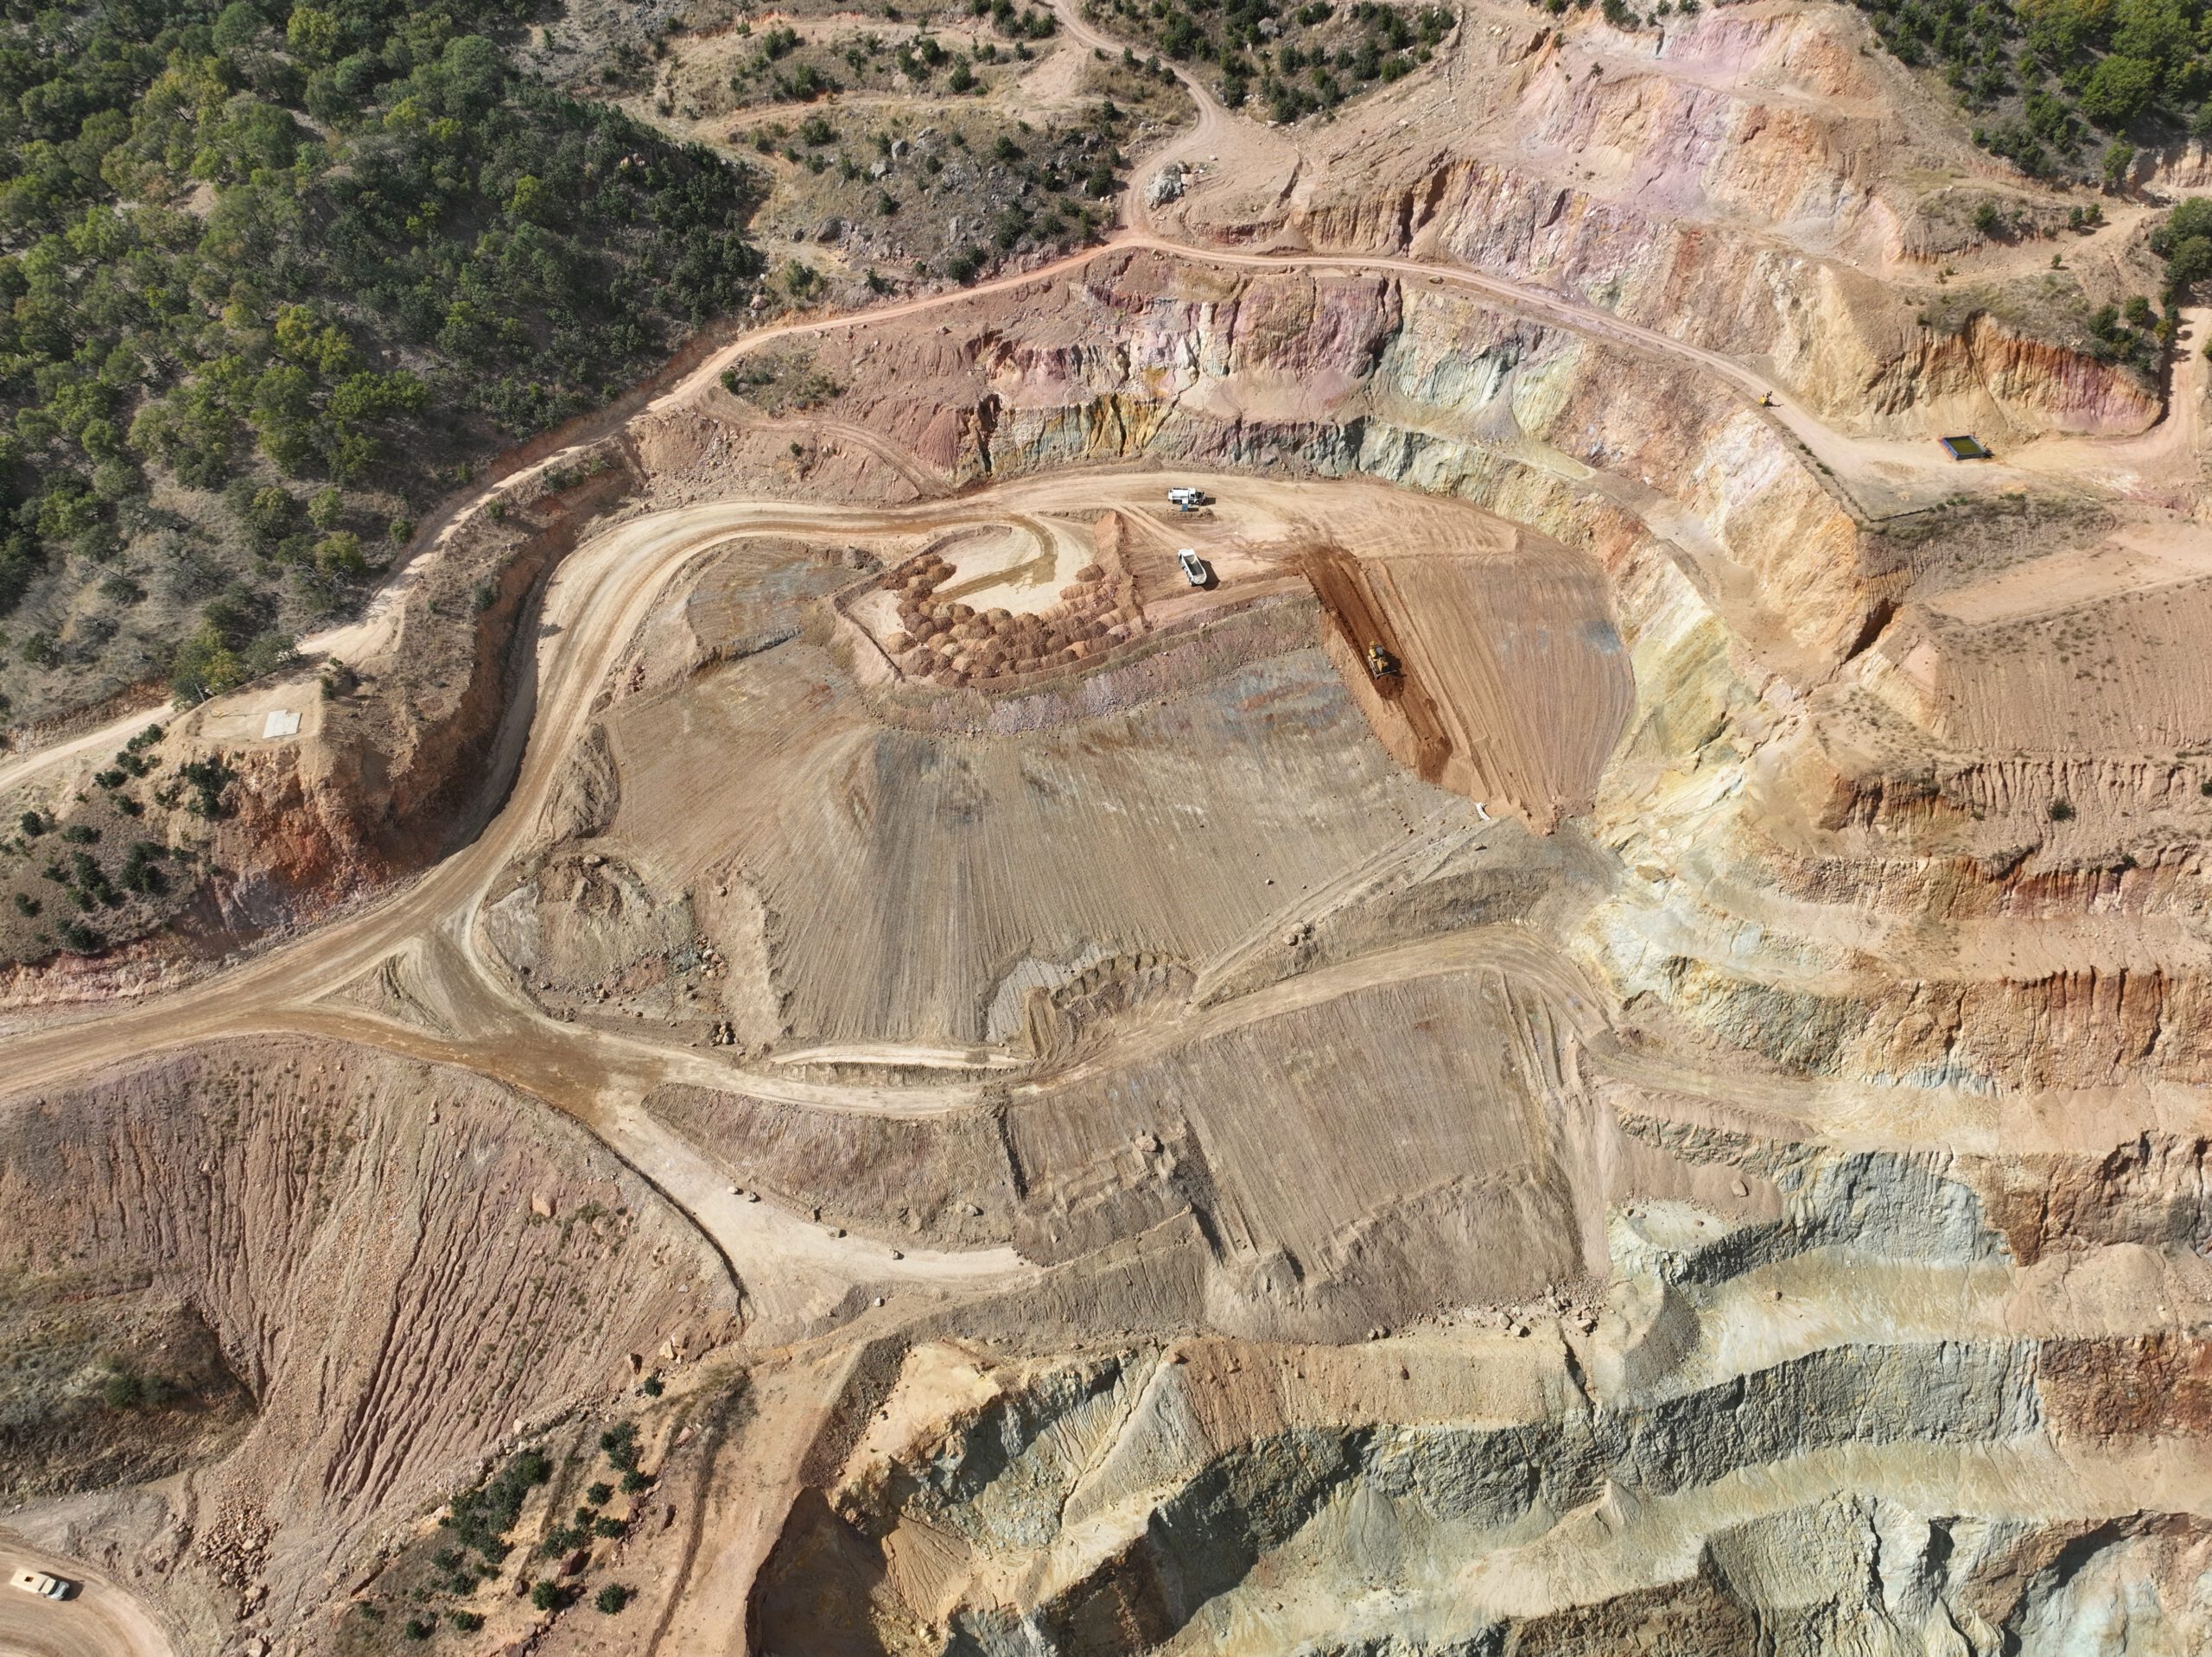
RECLAMATION
While mining inherently impacts nature throughout a mine’s lifecycle, some of these effects are positive. For example, water discharged from our sites is often of higher quality than the area’s baseline. At Young-Davidson, Alamos has seeded and covered historic mine tailings within the property, successfully reintroducing vegetation to previously unusable land. Many of the negative impacts of mining are temporary and are addressed during the closure and reclamation phases.
In keeping with our company-wide Mine Closure Standard, all Alamos mines have closure plans in place and are accounted for in our Asset Retirement Obligation (ARO) exercise. This fulfills our legal obligation in Canada to set aside sufficient funds for the decommissioning and reclamation of every mine we operate. Closure Plans and ARO budgets are annually reviewed, with independent audits ensuring financial accountability. We frequently update our closure plans in accordance with legislative requirements and leading industry practices. We practice progressive reclamation where possible, restoring disturbed land when it is no longer required. Increasingly, our reclamation efforts are guided by input from local communities, with the ultimate goal of rehabilitating sites to an ecologically healthy state that is agreed upon by local stakeholders. Responsibility for mine closure and rehabilitation lies at the most senior level of our organisation, with the Chief Operating Officer.
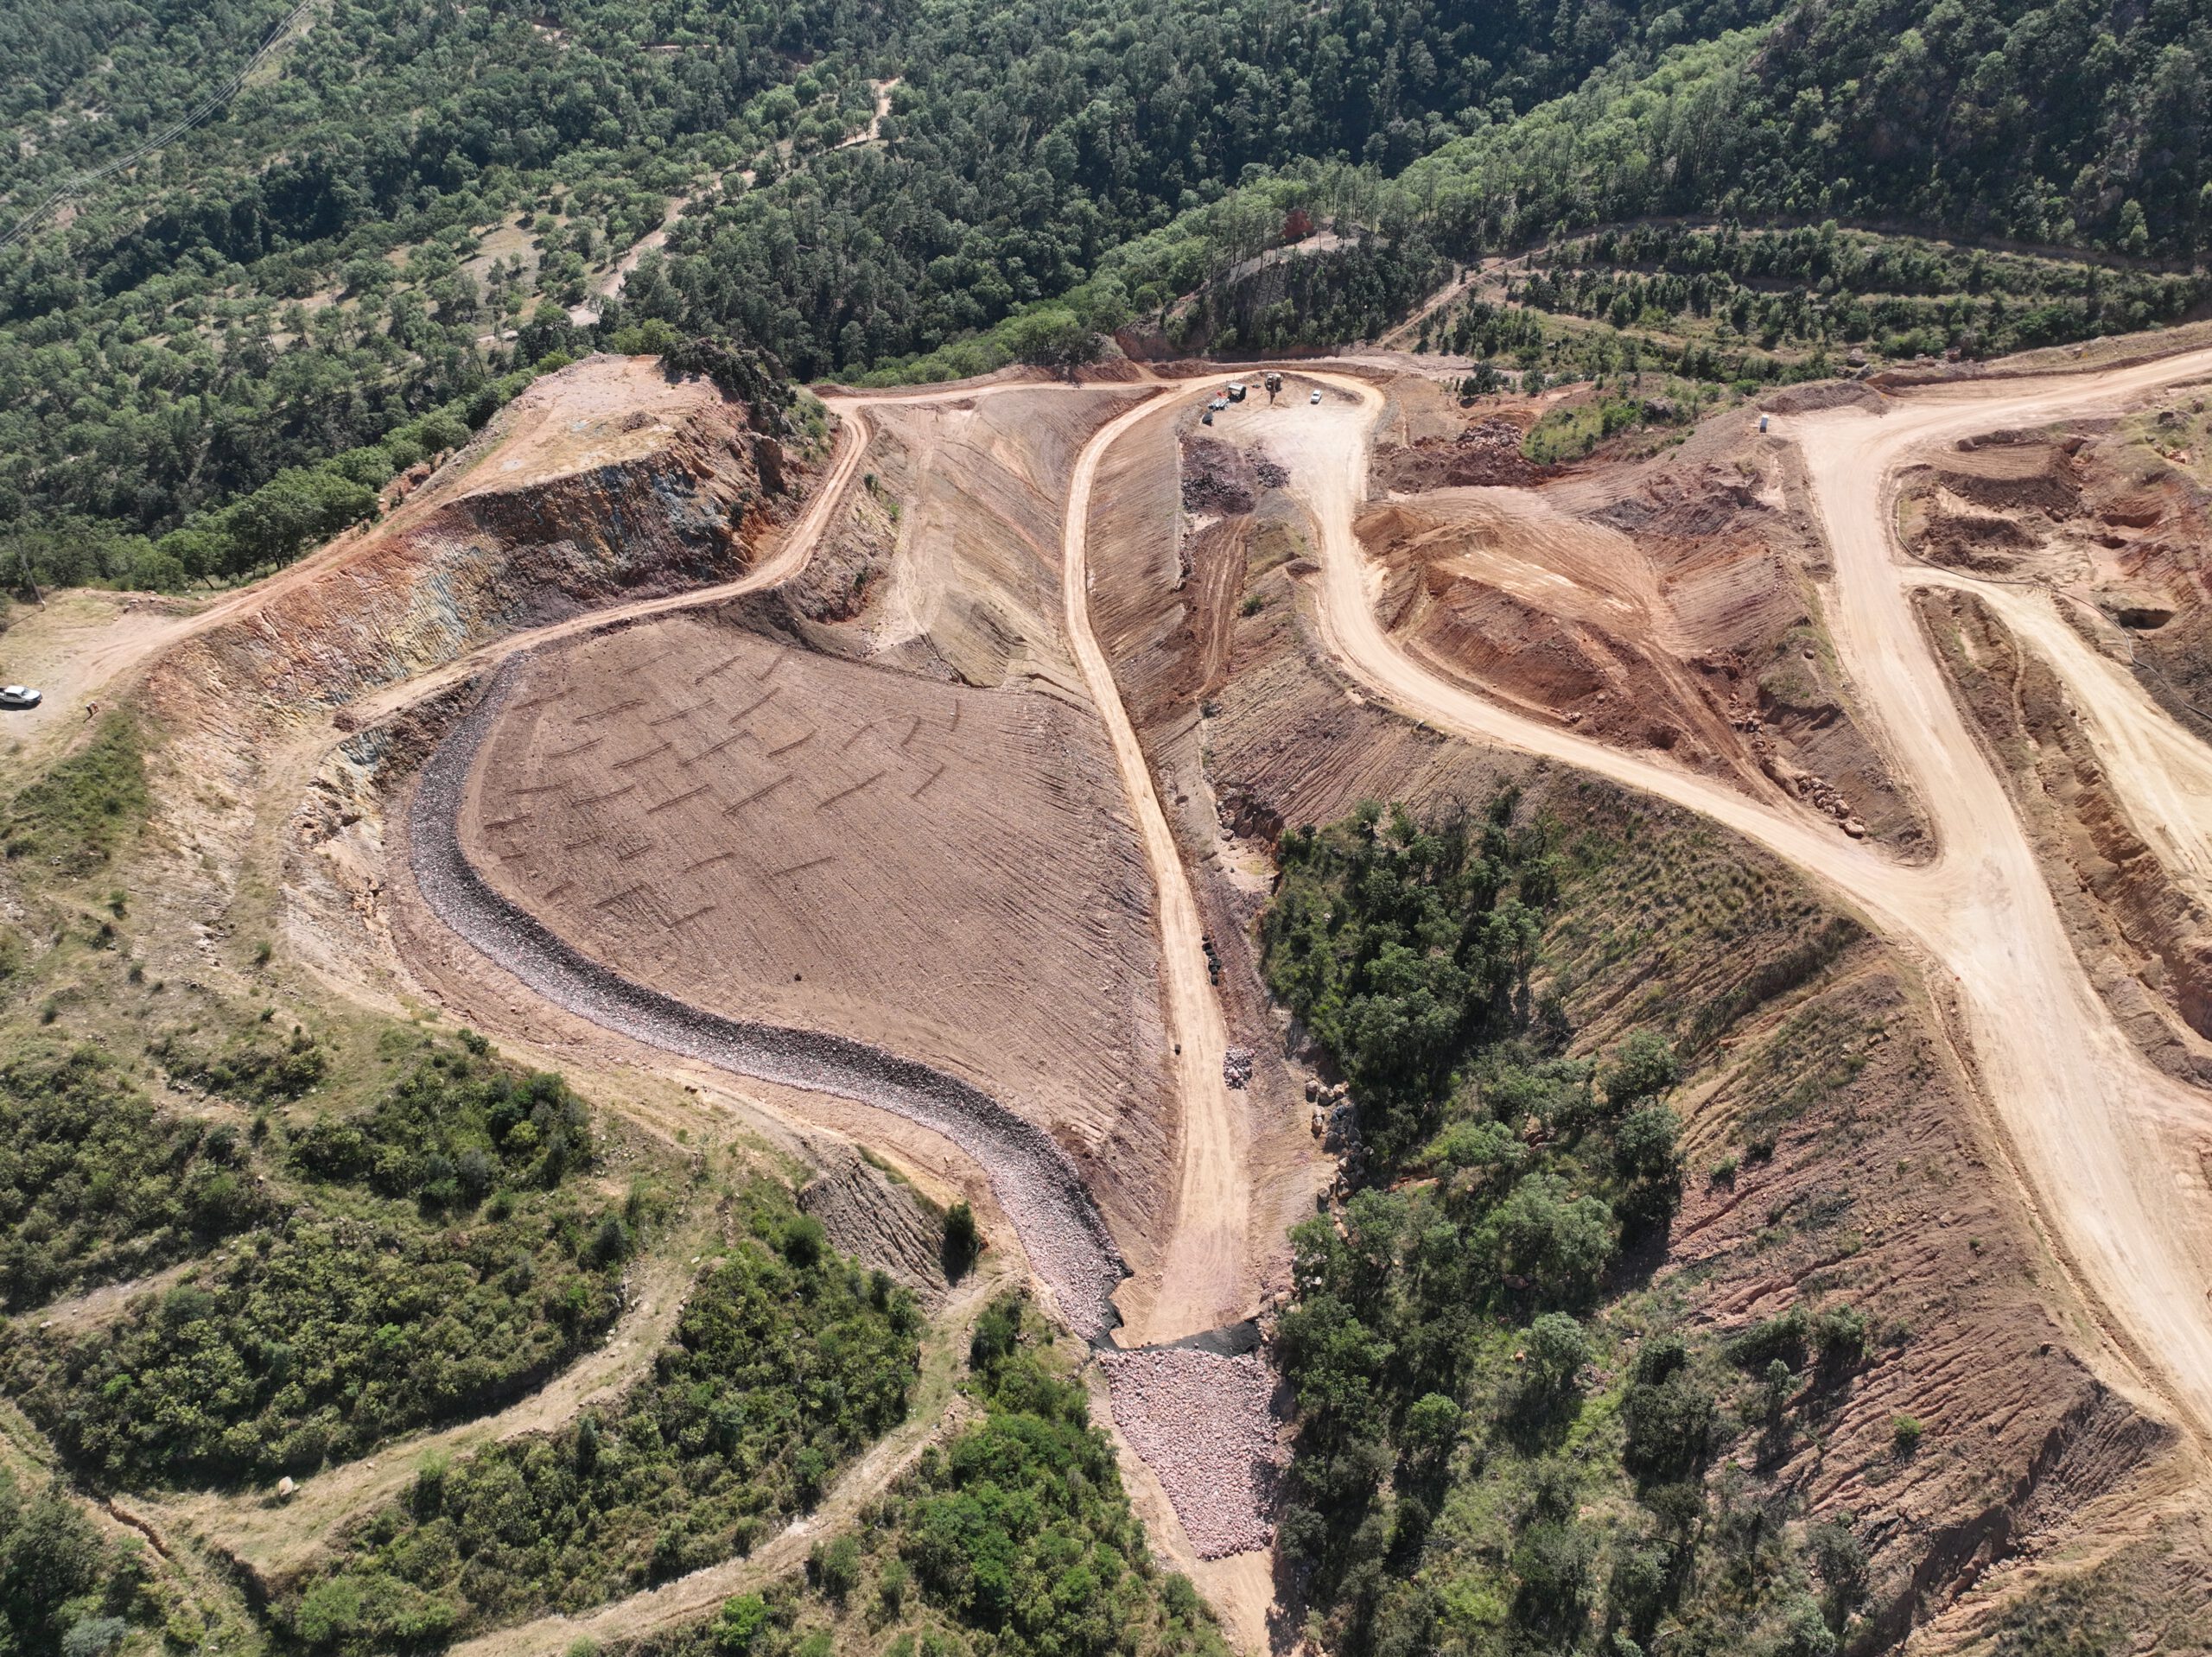
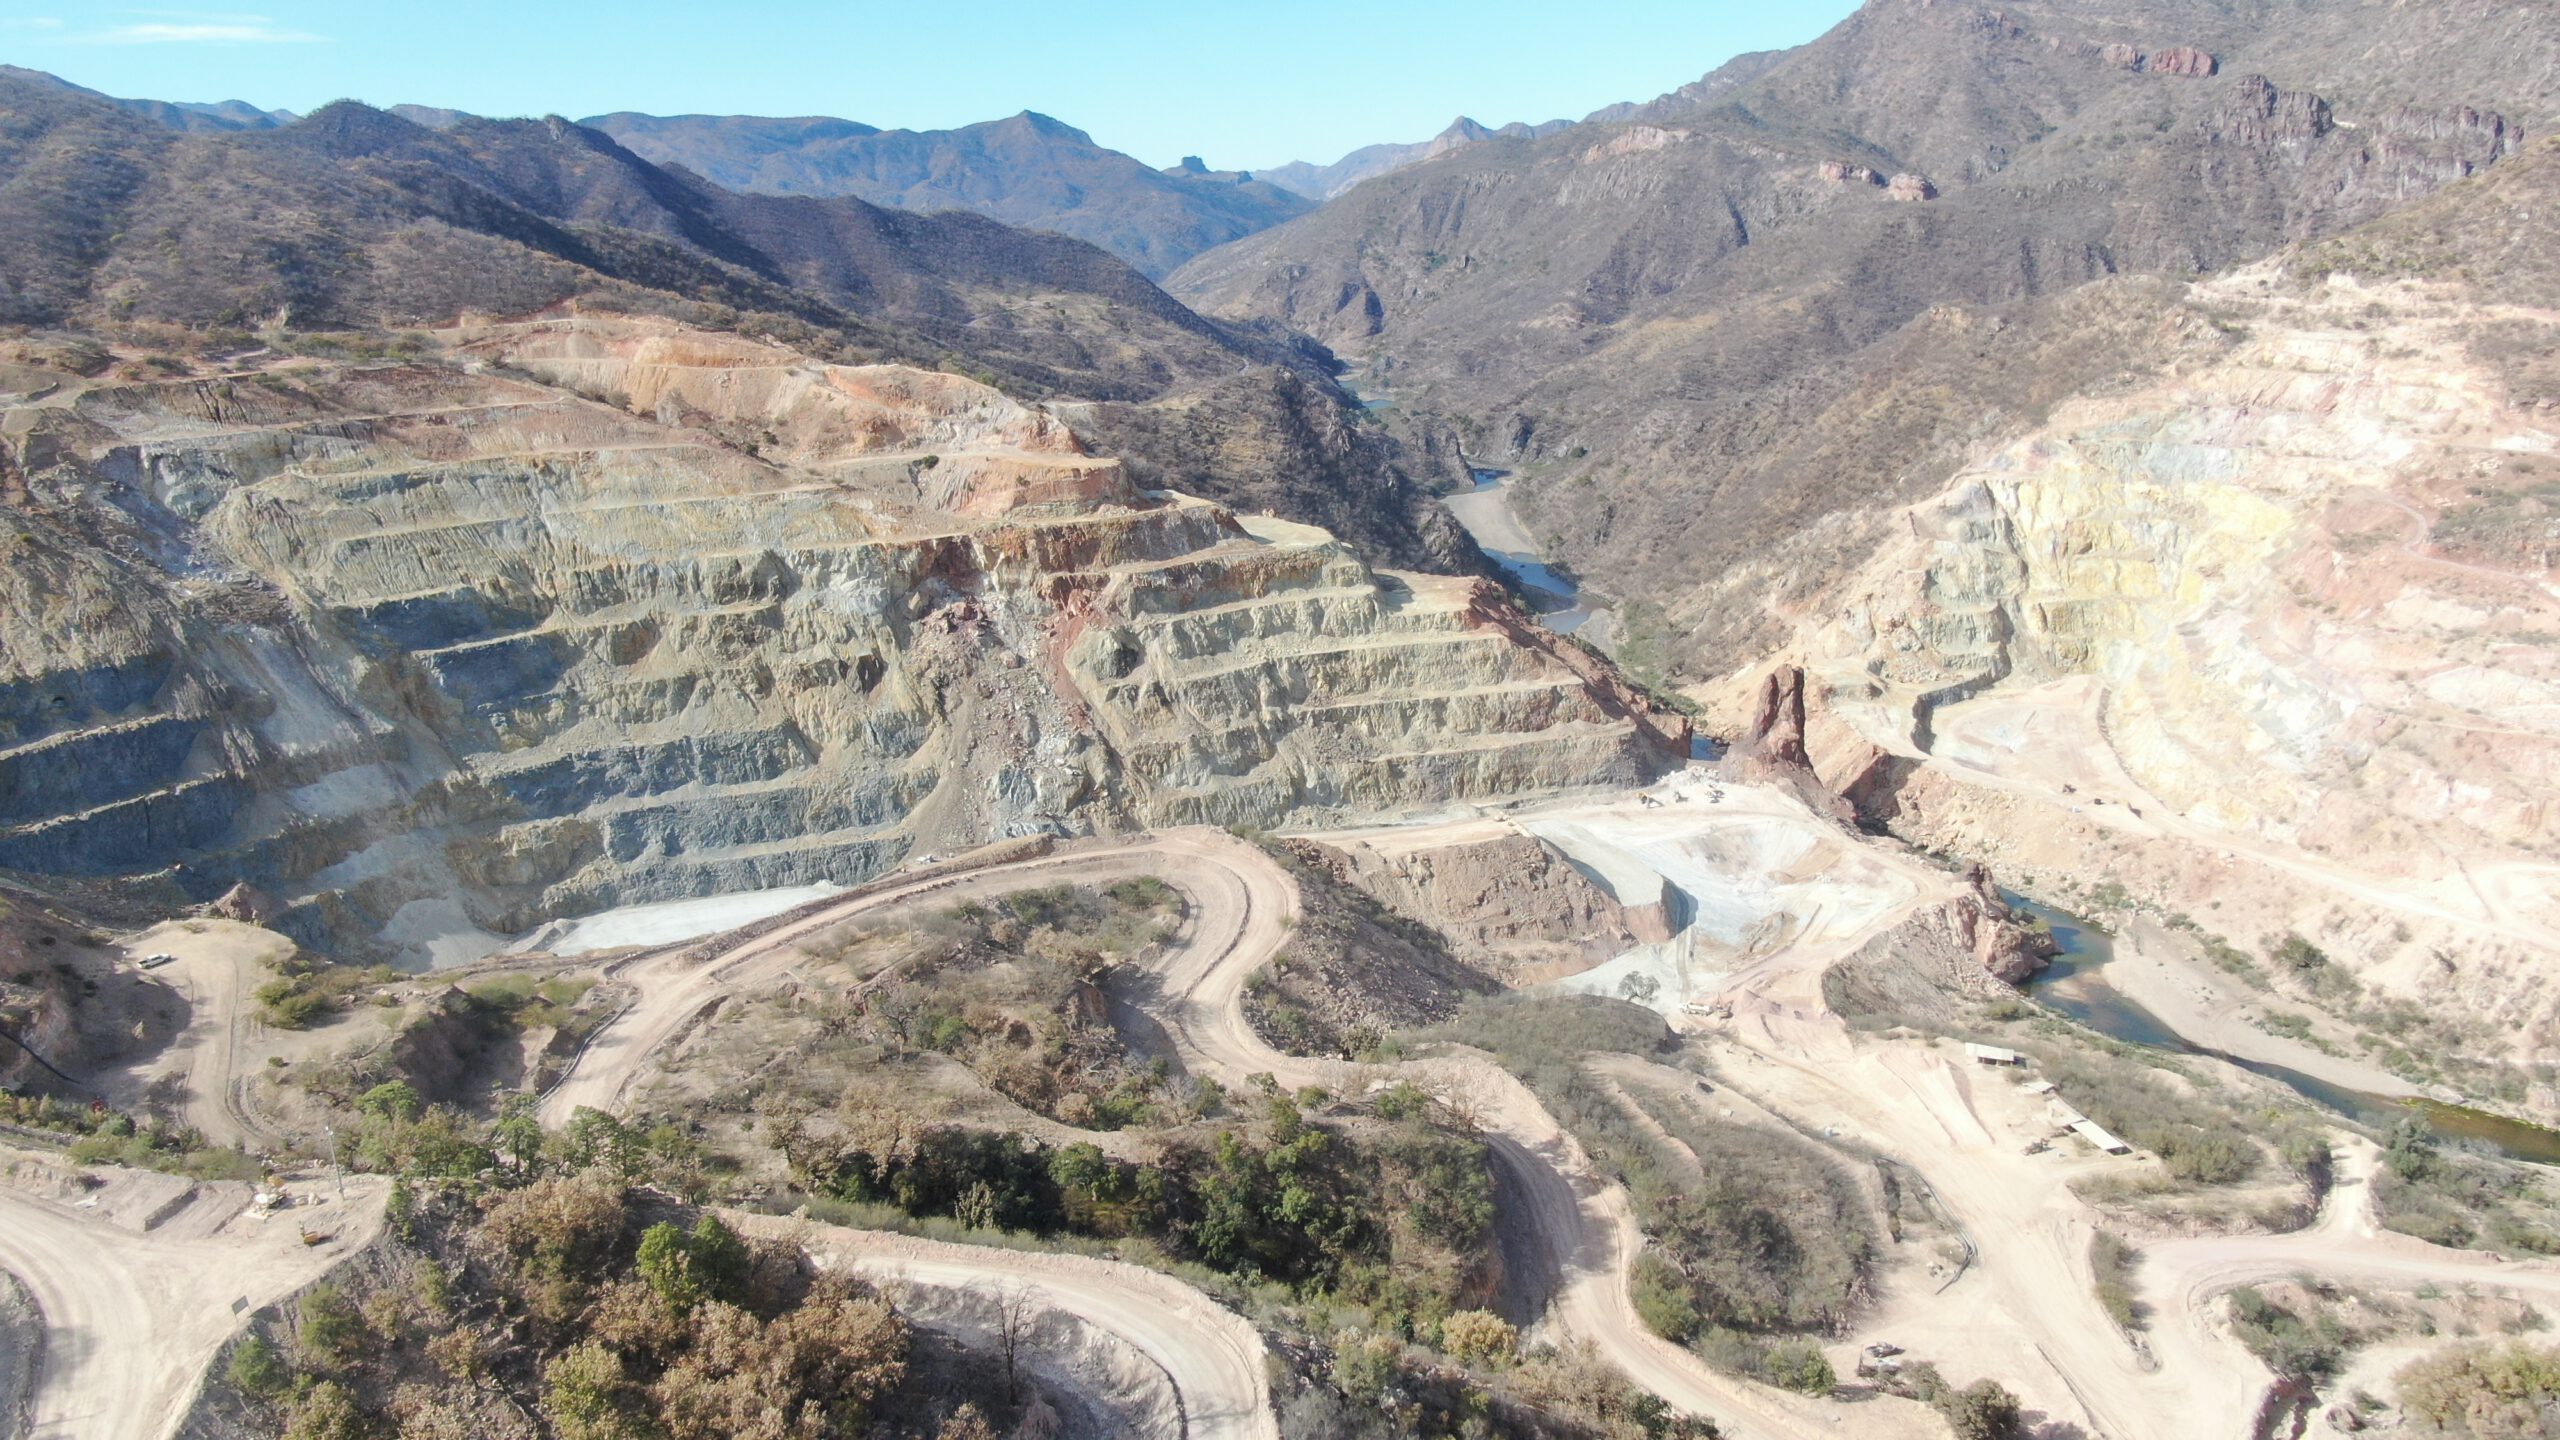
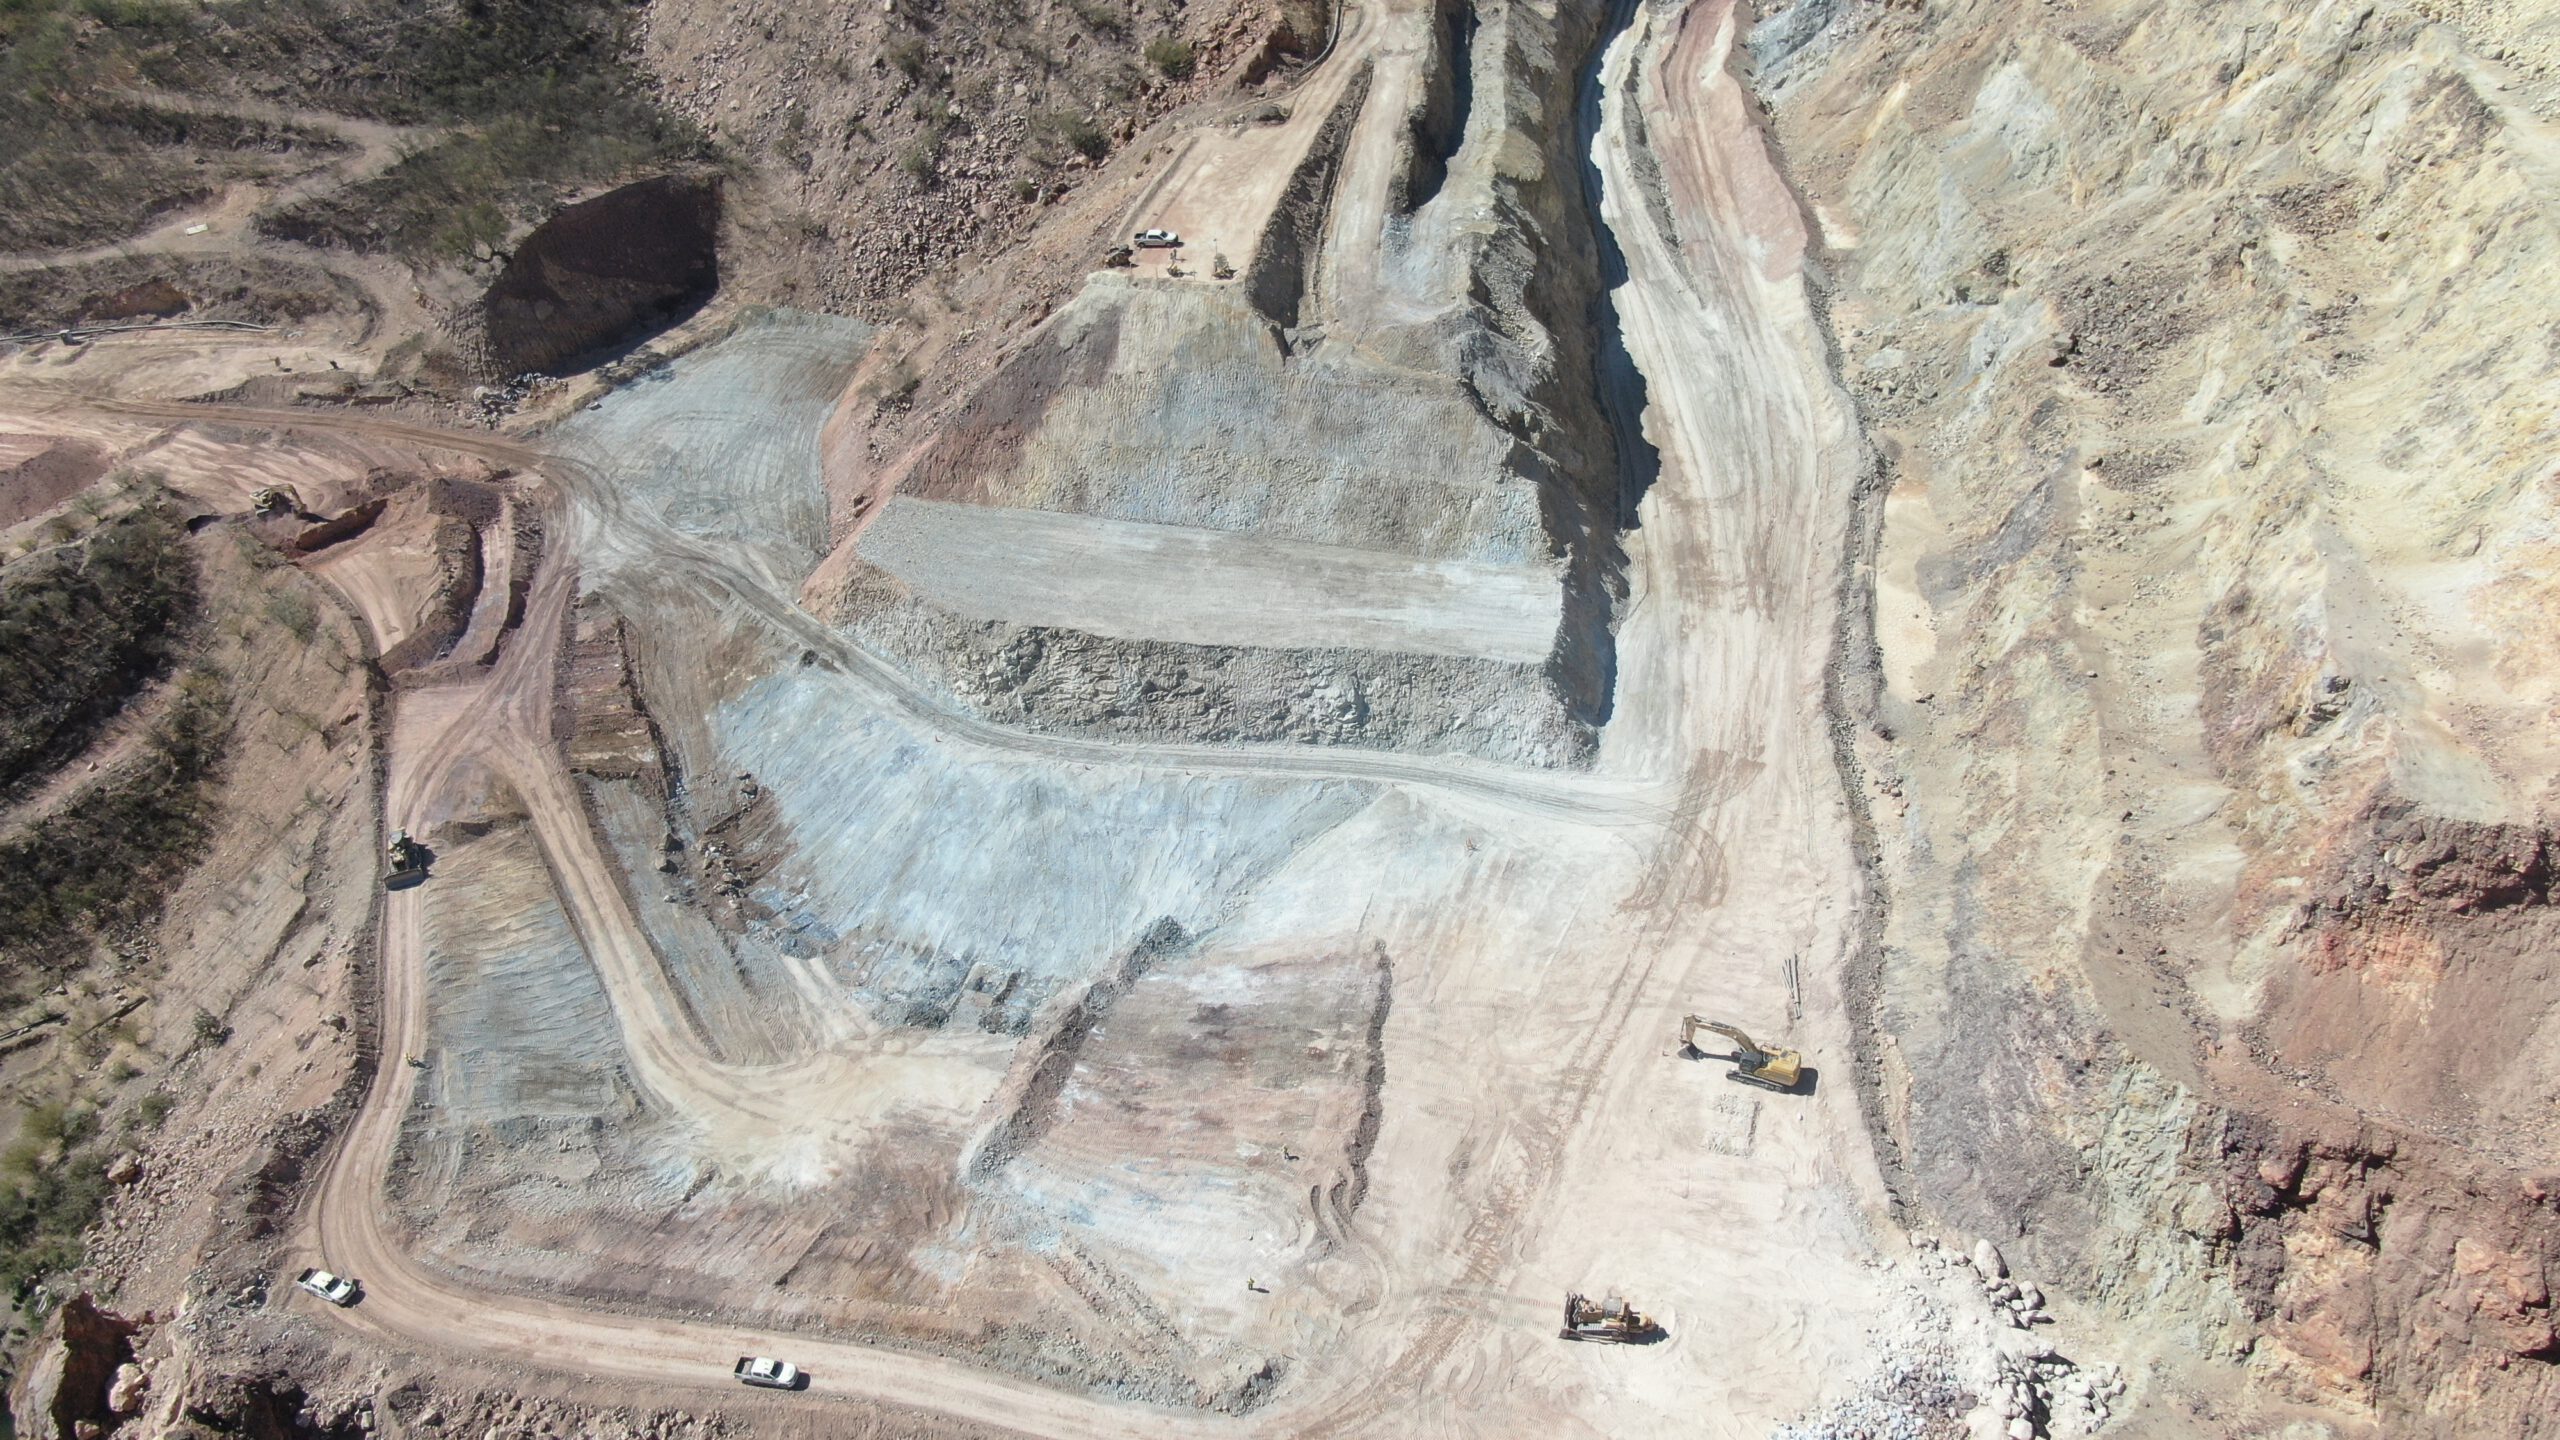
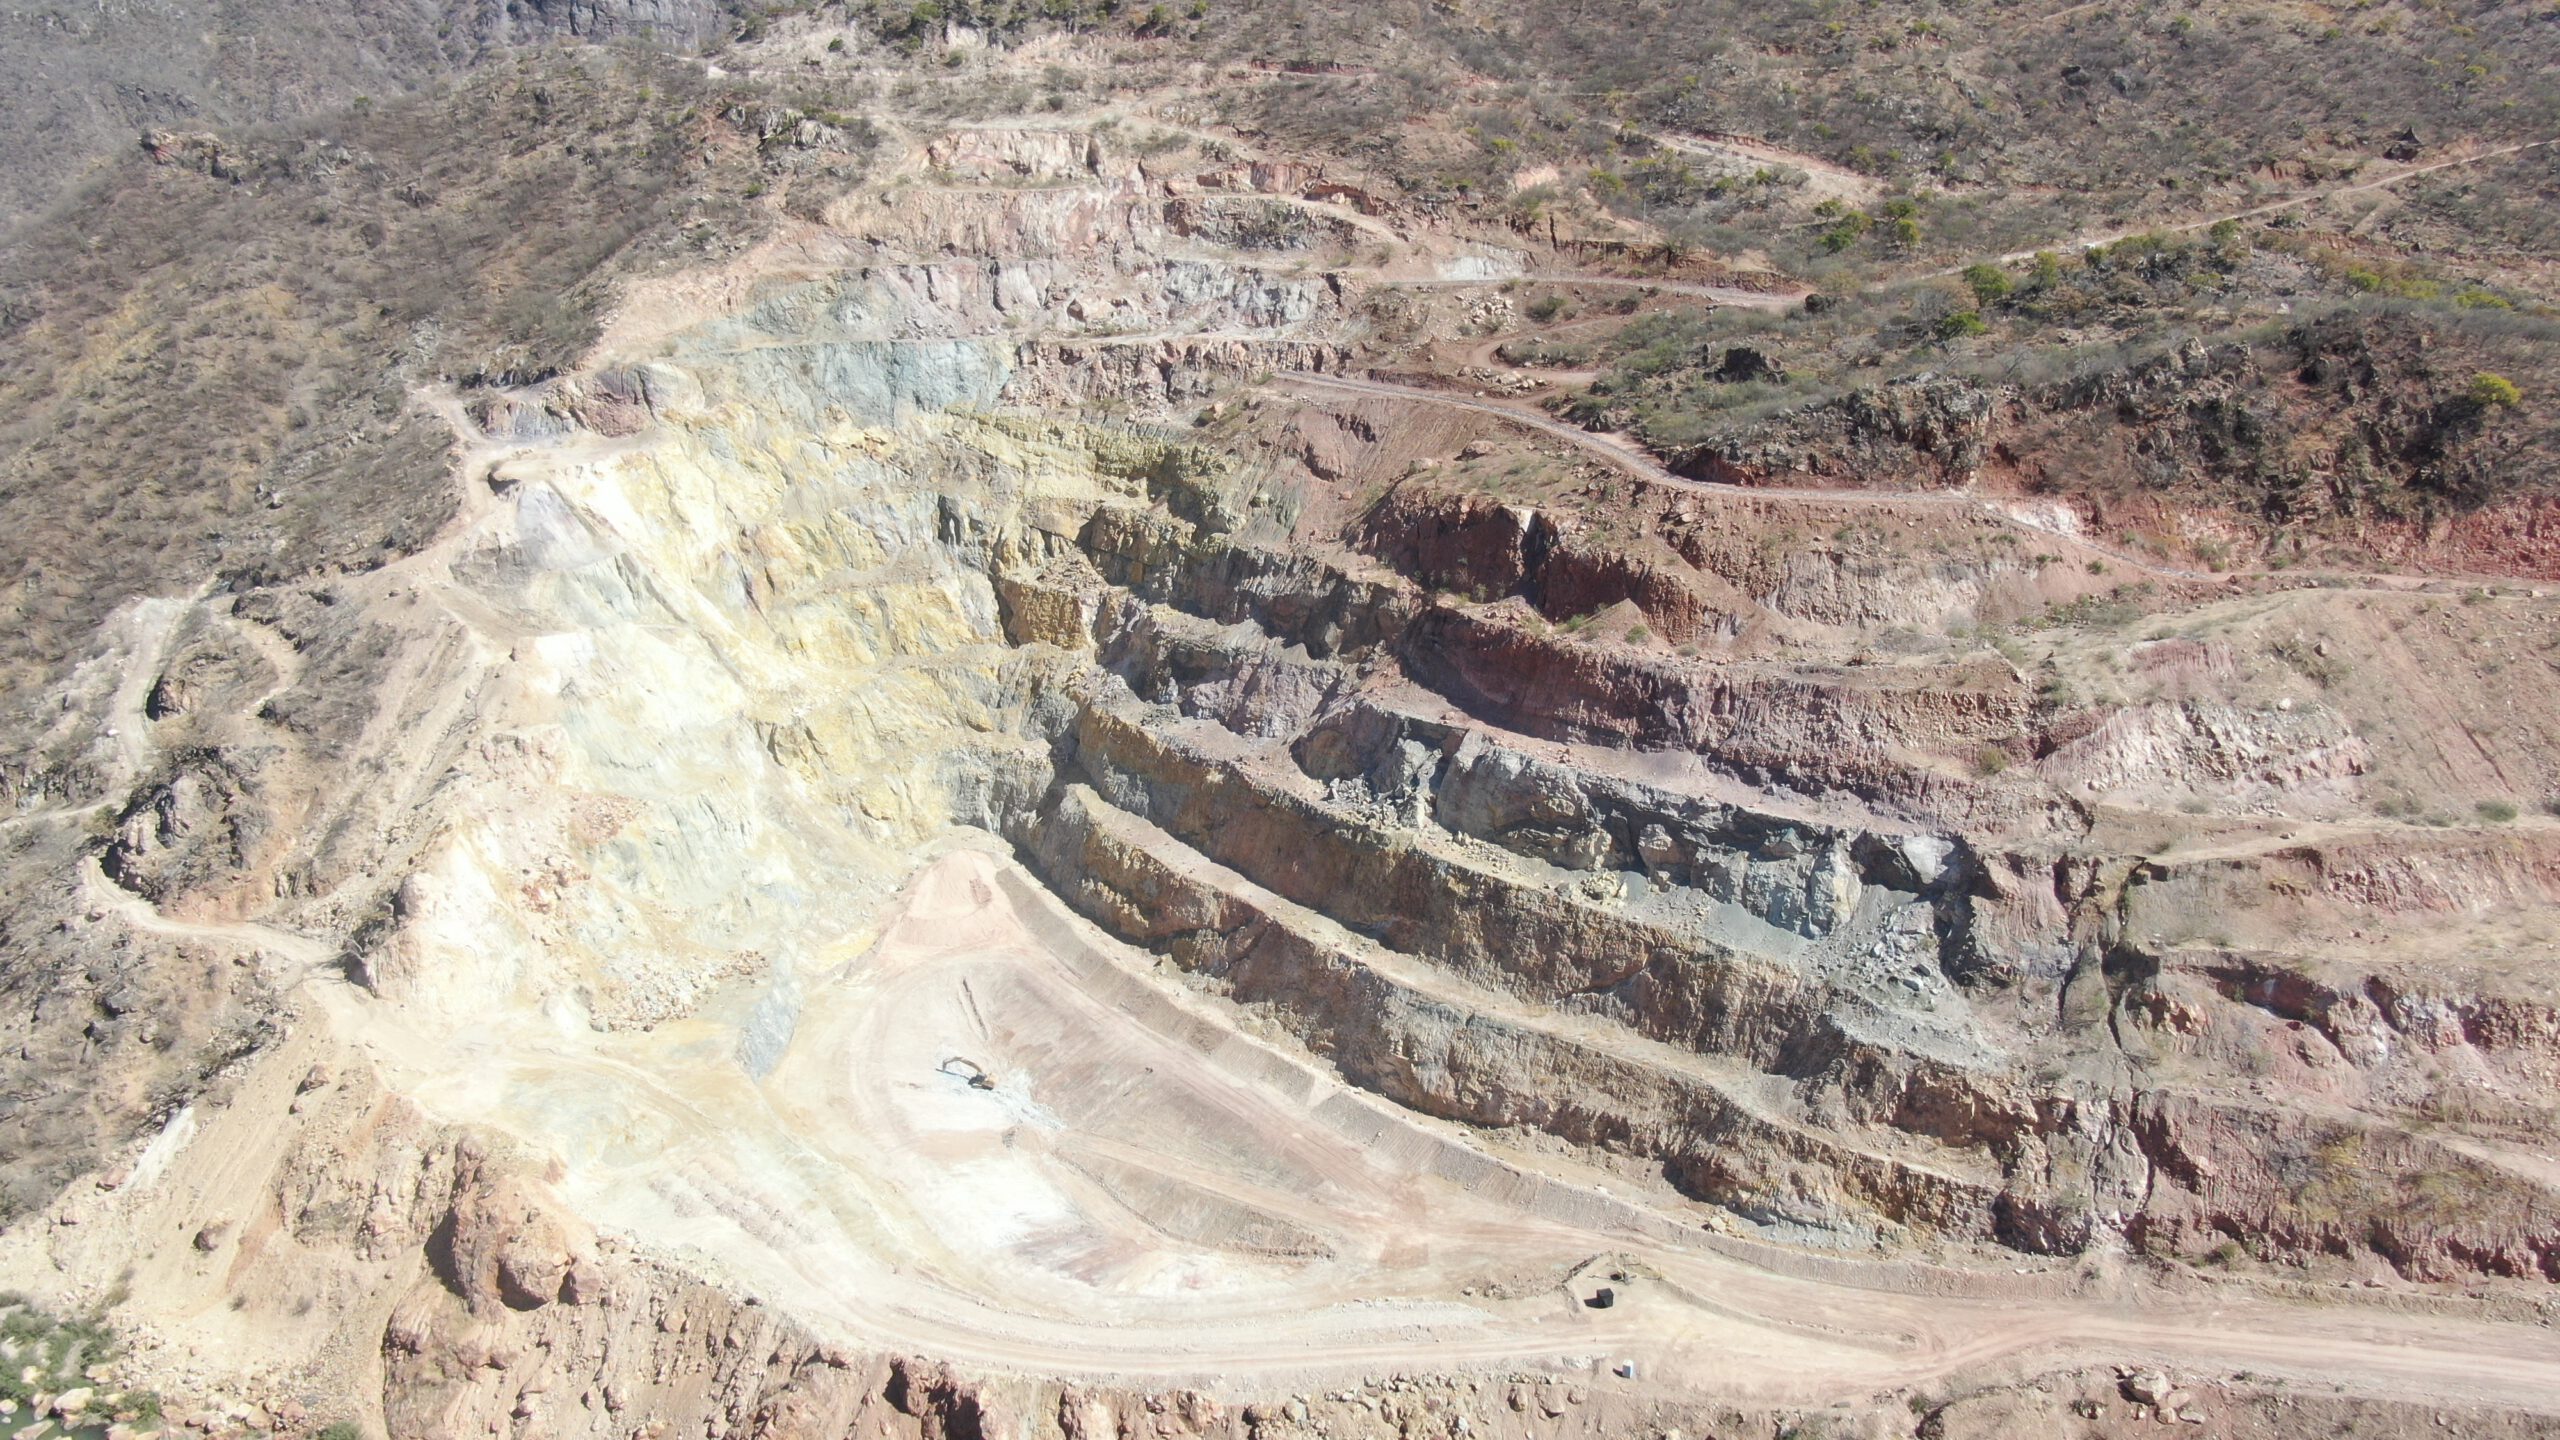
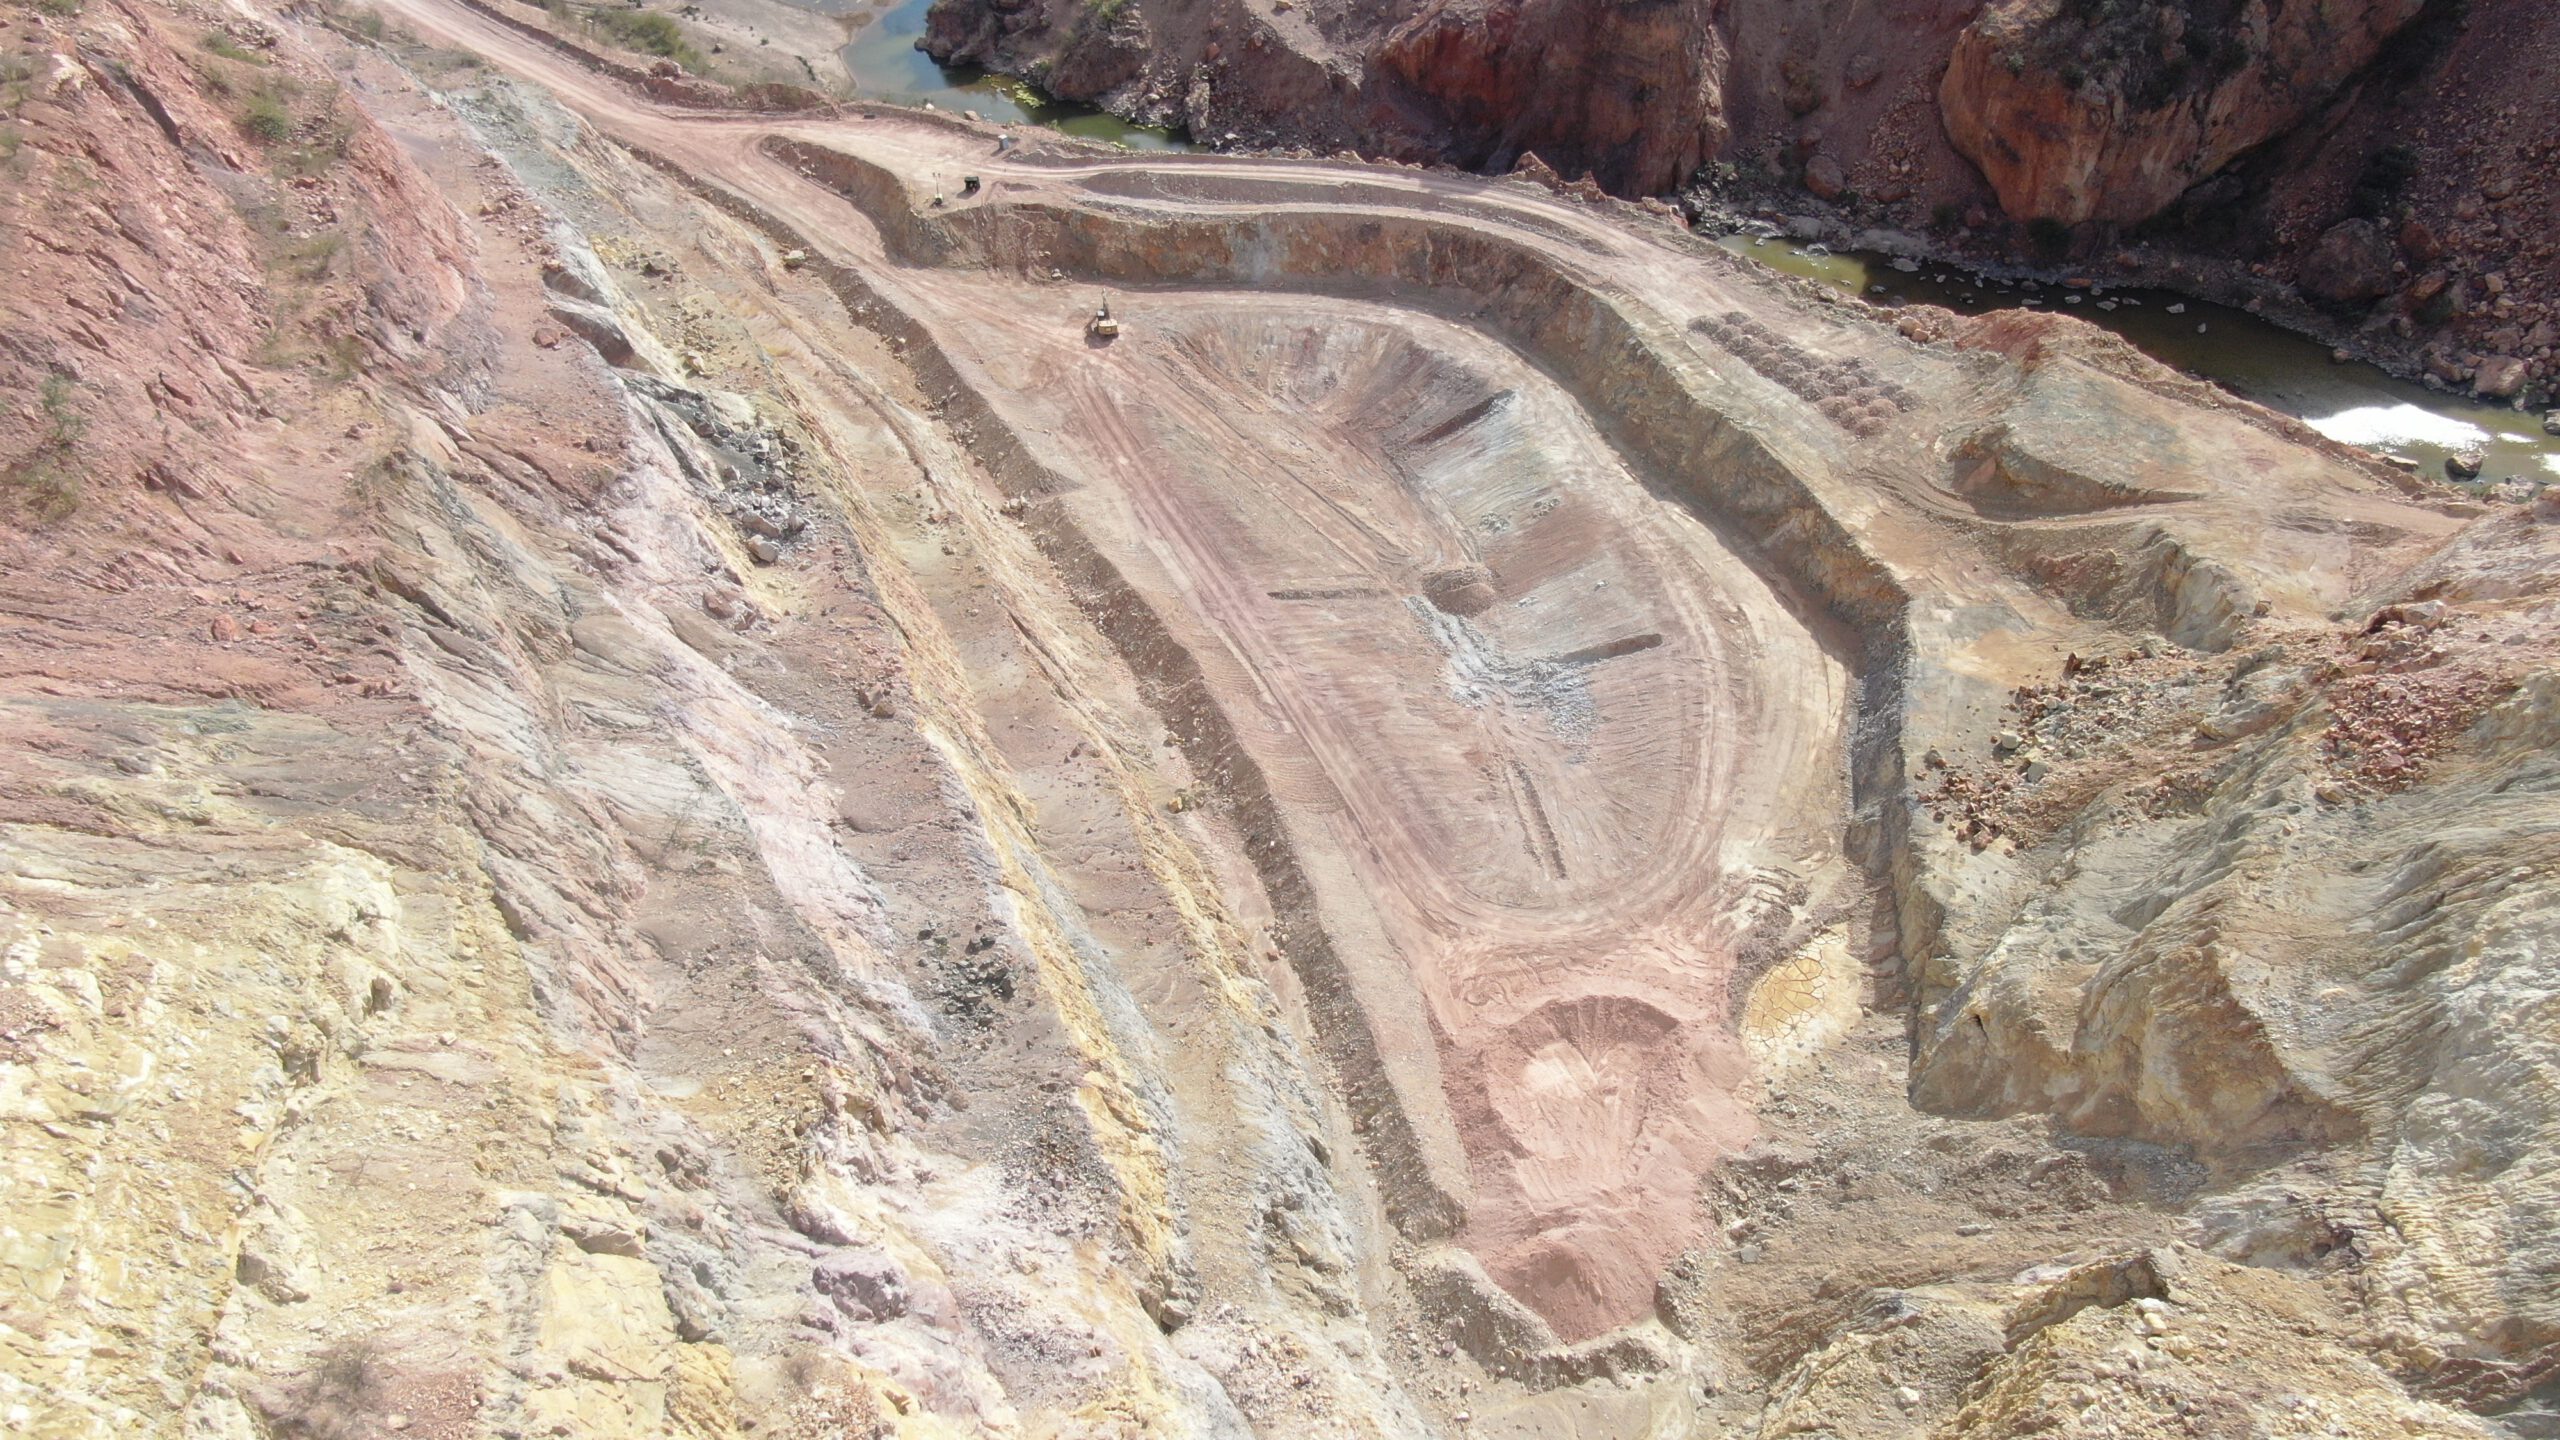
In 2024, Mulatos began rehabilitation work at three historic open pits – Cerro Pelon, El Victor and San Carlos – as well as La Sandia waste rock pile. The closure design for these open pits was developed over several years in preparation for reclamation activities. A key priority in these areas is managing water flow to minimize the need for treatment. Clean water is redirected away from the pits using diversion ditches, as any water within the pit catchment area requires treatment due to the acidic nature of the pit walls. In addition to water management, surrounding land will be covered with non-acid generating rock or soil and revegetated with plants grown at the on-site nursery. At La Sandia, an inactive area of the Mulatos site, the waste rock pile was regraded to achieve long-term slope stability, covered with non-acid generating material, and revegetated with native plants from the nursery.
References
- https://www.ieso.ca/en/Learn/Ontario-Electricity-Grid/Supply-Mix-and-Generation ↩
- Within the organization. Energy consumption outside of the organization is not tracked. ↩
- Propane and Compressed Natural Gas primarily represent energy used for heating, except at Magino, where Compressed Natural Gas has additional applications. Alamos does not use steam, and cooling is untracked, as it is included within overall electricity consumption. ↩
- Propane and Compressed Natural Gas primarily represent energy used for heating, except at Magino, where Compressed Natural Gas has additional applications. Alamos does not use steam, and cooling is untracked, as it is included within overall electricity consumption. ↩
- Alamos does not sell electricity. ↩
- Excludes Electricity Generated amounts, as its associated energy is already accounted for under Fuel Consumption. ↩
- Includes only energy use within the organization, from all energy types included in Energy Consumption table. ↩
- 2024 water metrics include the Magino mine (July to December 2024) for the first time, resulting in a material increase to several indicators. ↩
- 2023 data for Total Water Treated, Total Water Recycled/Reused, Total Water Used, and Portion of Water Recycled/Reused has been restated, due to the previous omission of water used in leach pads at Mulatos. This new inclusion has resulted in a material increase to these indicators. ↩
- 2022 data for Total Water Treated, Total Water Recycled/Reused, Total Water Used, and Portion of Water Recycled/Reused has been restated, due to the previous omission of water used in leach pads at Mulatos. This new inclusion has resulted in a material increase to these indicators. ↩
- No Alamos operation uses Mercury (Hg) in the processing of gold. ↩
- No water is withdrawn or discharged to water stressed areas. ↩
- 100% of Young-Davidson water withdrawals are freshwater (<1000mg/L Total Dissolved Solids) ↩
- 100% of Young-Davidson water discharges are freshwater (<1000mg/L Total Dissolved Solids) ↩
- Cubic meter of water consumed per tonne of ore treated. ↩
- No water is withdrawn or discharged to water stressed areas. ↩
- 100% of Island Gold’s water withdrawals are freshwater (<1000mg/L Total Dissolved Solids) ↩
- 98.2% of Island Gold’s water discharges are freshwater (<1000mg/L Total Dissolved Solids) ↩
- Cubic meter of water consumed per tonne of ore treated. ↩
- No water is withdrawn or discharged to water stressed areas. ↩
- 100% of Magino’s water withdrawals are freshwater (<1000mg/L Total Dissolved Solids) ↩
- 100% of Magino’s water discharges are freshwater (<1000mg/L Total Dissolved Solids) ↩
- Cubic meter of water consumed per tonne of ore treated. ↩
- Aqueduct Water Risk Atlas (wri.org) ↩
- No water is withdrawn or discharged to water stressed areas. ↩
- 100% of Mulatos’ water withdrawals are freshwater (<1000mg/L Total Dissolved Solids) ↩
- 100% of Mulatos’ water discharges are freshwater (<1000mg/L Total Dissolved Solids) ↩
- Cubic meter of water consumed per tonne of ore treated. ↩
- Does not include off-site camp. ↩
- Does not include off-site camp. ↩
- Sent to off-site landfills for Young-Davidson and Island Gold, and to an on-site landfill at Mulatos. ↩
- For mineral waste, disposal refers to safe on-site storage for eventual remediation. ↩
- Does not include off-site camp. ↩
- Does not include off-site camp. ↩
- Non-Potentially Acid Generating Waste Rock. ↩
- Potentially Acid Generating Waste Rock. ↩
- All Tailings are considered hazardous. ↩
- Tailings used as paste fill. ↩
- This sum does not include non-hazardous mineral waste recycled/reused, as this year, all waste rock applied on site was taken from stockpiles generated in previous years. ↩
- Does not include off-site camp. ↩
- Does not include off-site camp. ↩
- Includes dominantly mineral waste stored on-site. See Non-Mineral Waste disposal totals for total waste sent to landfill. ↩
- Note that the Total Waste Generated figures are not necessarily the sum of the two rows above, as much of the mineral waste reused in 2024 (applied on site for construction or back-filling purposes) was generated in previous reporting years. ↩
- Restated to omit the estimation previously reported for Mulatos, which has been reconsidered for inclusion to prioritise accuracy. ↩
- Black Ash (Fraxinus nigra) ↩
- European Eel (Anguilla anguilla) ↩
- Mojave Desert Tortoise (Gopherus agassizii) ↩
- Little Brown Bat (Myotis lucifugus) ↩
- Eastern Small-footed Bat (Myotis leibii) and Little Brown Bat (Myotis lucifugus) ↩
- Little Brown Bat (Myotis lucifugus) ↩
- Gila Chub (Gila intermedia) and Yaqui Catfish (Ictalurus pricei) ↩
- Little Brown Bat (Myotis lucifugus) and Lake Sturgeon (Acipenser fulvescens) ↩
- Steppe Eagle (Aquila nipalensis) ↩
- Little Brown Bat (Myotis lucifugus), Monarch Butterfly (Danaus plexippus), Northern Myotis (Myotis septentrionalis) ↩
- Little Brown Bat (Myotis lucifugus) and Northern Myotis (Myotis septentrionalis) ↩
- Little Brown Bat (Myotis lucifugus) and Northern Myotis (Myotis septentrionalis) ↩
- Gila Chub (Gila intermedia), Yaqui Chub (Gila purpurea), Sonora Sucker (Catostomus insignis) ↩
- Little Brown Bat (Myotis lucifugus) and Northern Myotis (Myotis septentrionalis) ↩
- Bank Swallow (Riparia riparia) and Black Ash (Fraxinus nigra) ↩
- Canada Warbler (Cardellina canadensis) ↩
- Canada Warbler (Cardellina canadensis), Chimney Swift (Chaetura pelagica), Common Nighthawk (Chordeiles minor), Olive-sided Flycatcher (Contopus cooperi), Whip Poor Will (Antrostomus vociferus), Boreal Chorus Frog (Pseudacris maculata) ↩
- Longfin Dace (Agosia chrysogaster), Rio Grande Sucker (Catostomus plebeius), Yaqui Catfish (Ictalurus pricei), Gila Topminnow (Poeciliopsis occidentalis), Chiricahua Leopard Frog (Lithobates chiricahuensis), Blackneck Garter Snake (Thamnophis cyrtopsis), Sonoran Coral Snake (Micruroides euryxanthus), Neotropical Otter (Lontra longicaudis) ↩
- Woodland Caribou (Rangifer tarandus caribou), Common Nighthawk (Chordeiles minor), Short-eared Owl (Asio flammeus), Olive-sided Flycatcher (Contopus cooperi), Bank Swallow (Riparia riparia), Barn Swallow (Hirundo rustica) ↩
- Peregrine Falcon (Falco peregrinus), American Bumble Bee (Bombus pensylvanicus), and Rusty Blackbird (Euphagus carolinus) ↩
- Yellow-banded Bumble Bee (Bombus terricola) ↩
- Eastern Wood Pewee (Contopus virens) and Bald Eagle (Haliaeetus leucocephalus) ↩
- Yaqui Sucker (Catostomus bernardini), Tarahumara Salamander (Ambystoma rosaceum), Madrean Alligator Lizard (Elgaria kingii), Northern Pigmy Skink (Plestiodon parviauriculatus), Black-tailed Rattlesnake (Crotalus molossus), Montezuma Quail (Cyrtonyx montezumae), Cooper’s Hawk (Accipiter cooperii), Common Black Hawk (Buteogallus anthracinus), Swainson’s Hawk (Buteo swainsoni), Brown-backed Solitaire (Myadestes occidentalis) ↩
- Wolverine (Gulo gulo), Yellow Rail (Coturnicops noveboracensis), Evening Grosbeak (Coccothraustes vespertinus), Rusty Blackbird (Euphagus carolinus), Northern Leopard Frog (Lithobates pipiens), Yellow-banded Bumble Bee (Bombus terricola), and Transverse Lady Beetle (Coccinella transversoguttata) ↩
- For the purposes of representing Alamos’ land use, this figure includes all land inside each site’s most recent Closure boundary (the area Alamos may be responsible to rehabilitate at the end of the life of mine). Note that this entire area will not necessarily be disturbed/altered. ↩